Chart Vizzard
Vizzlo's AI-based chart generatorMarch 9, 2017 • 3 min read
Introducing Vizzlo’s new project management charts
Portfolio enhancements to power your presentations!

Vizzlo has one purpose: make presentations more effective and pleasant and working life simpler and more productive for everyone. Professionals from different areas — sales, marketing, project managers, consultants, educators, etc. — have already discovered our charts for their presentations and reports.
We’ve decided to go deeper into these areas and offer solutions that enable the creation of visual aids for entire presentation decks using Vizzlo. As a first step, we’ve tackled the project management area — simply because it’s transdisciplinary and offers management frameworks and concepts that are useful to all other areas.
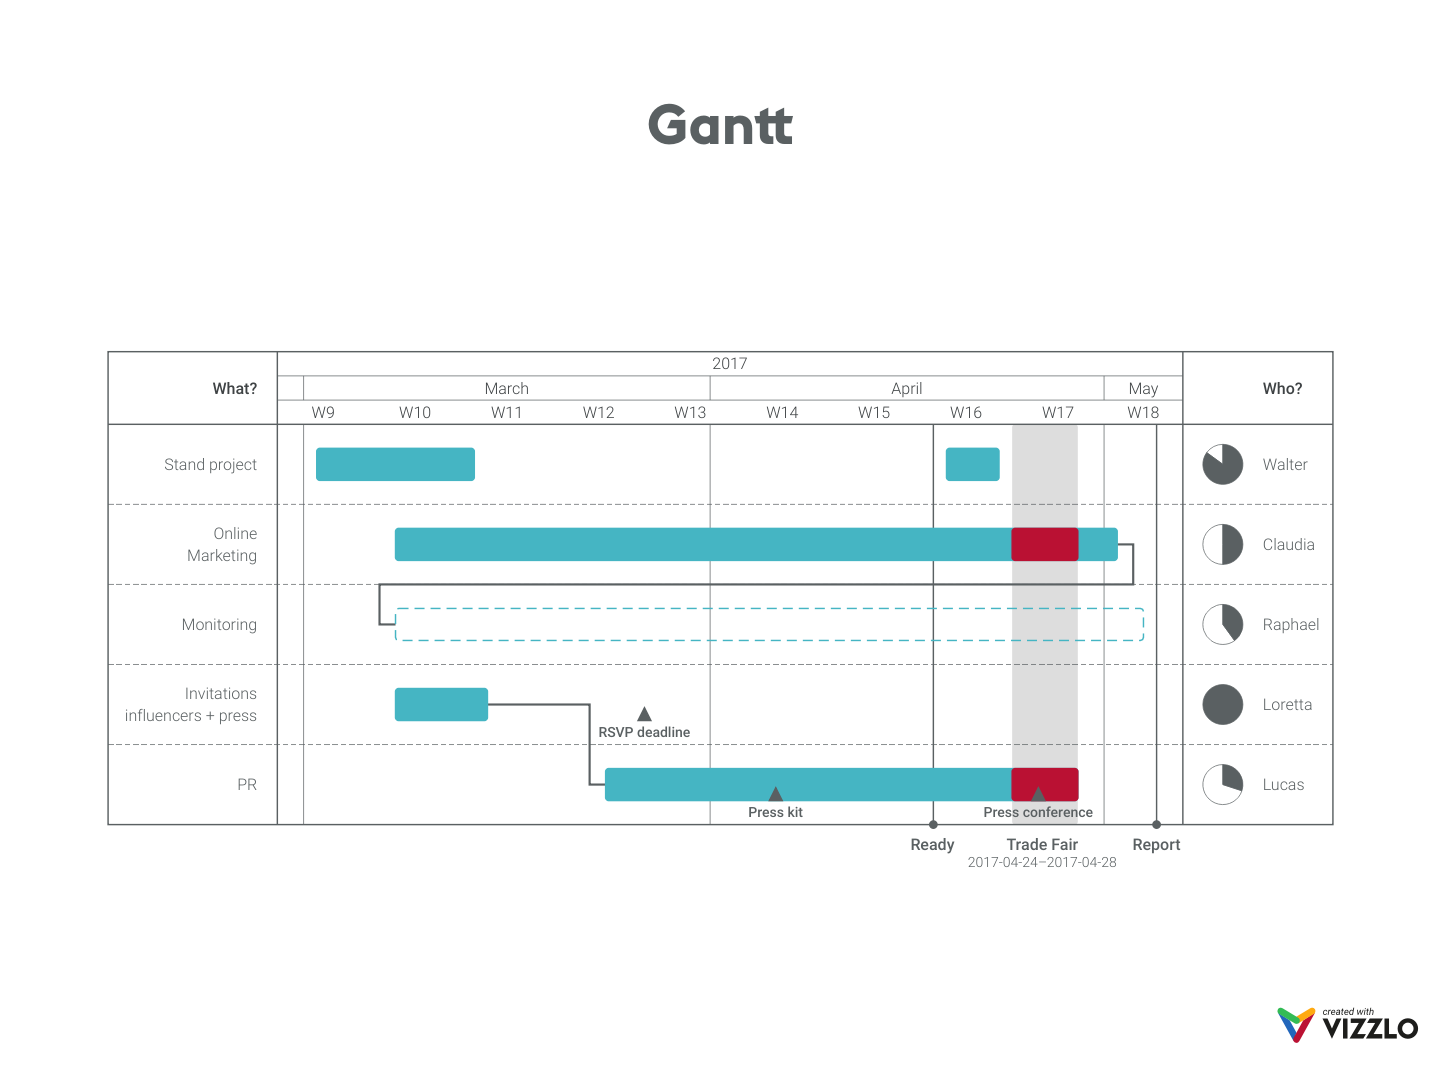
For this, we’ve created three new charts: a detailed “Gantt” chart, a “Project Phase” chart, and a “Progress Bar” chart; and improved another two: the “Timeline” and “Milestones as Arrow” charts.
These five charts will make the communication of project plans and progress more compelling. Moreover, while developing them, we’ve taken Vizzlo’s usability to the next level. All these charts are now completely interactive; you just need to click on any element to edit it (we are gradually implementing this new standard with all our charts). Consequently, these five charts are incredibly easy to create, saving your precious time.
The charts
The new “Gantt” chart: developed for complex project schedules to make the plan readable, the tasks’ dependencies clear, and the progress easily tracked.
The “Project Phase” chart: flexible enough to fit any project life cycle.
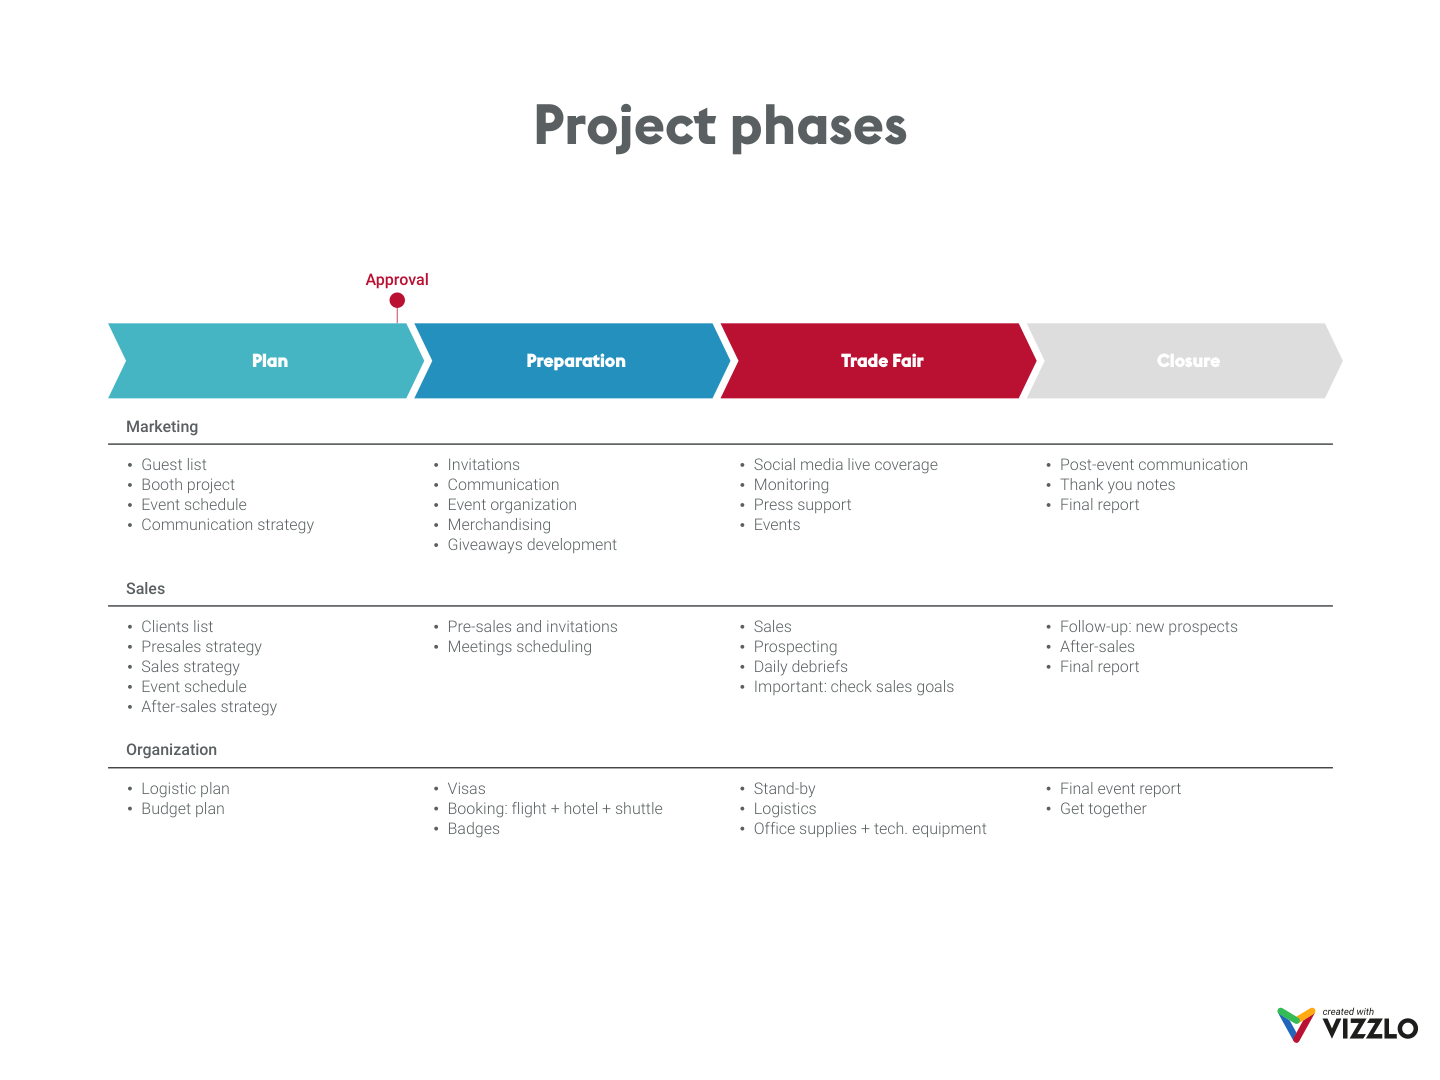
Project managers have learned that the project life cycle has five major phases: conception and initiation, planning, execution, monitoring, and, finally, project close. However, there have been industry variations to and several adaptions of this framework. That’s why we’ve made our chart adjustable to any project; it will encompass the whole life cycle, with its phases/stages, according to your needs.
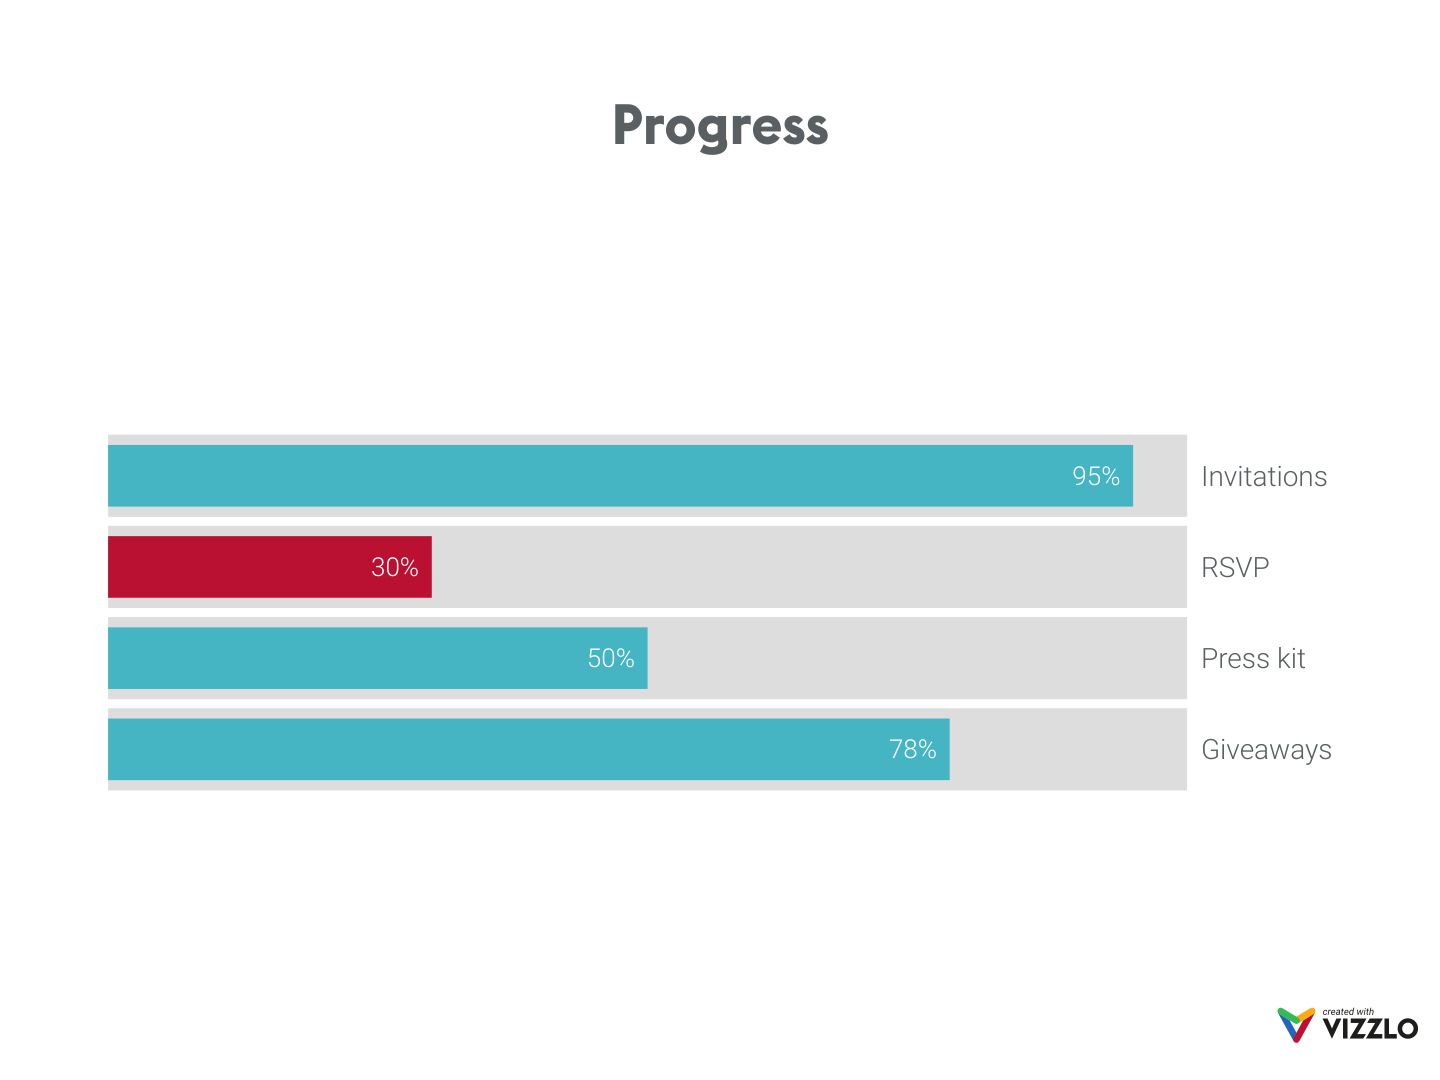
The “Progress Bar” chart: an elegant and useful visualization of the status of your work in progress.
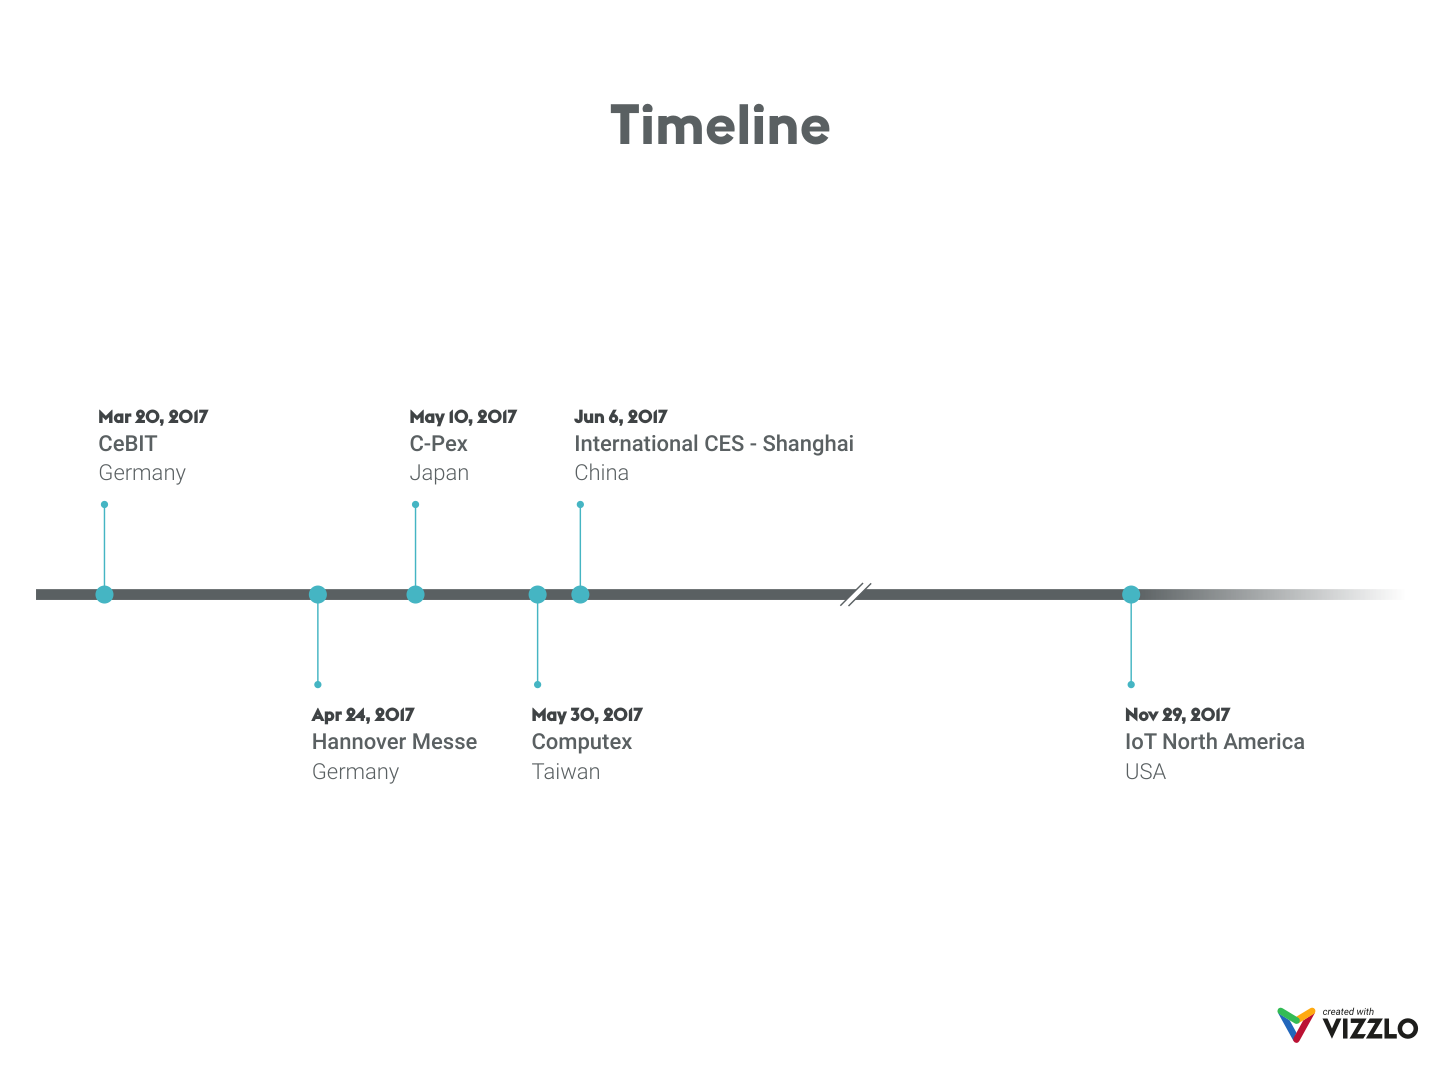
The “Timeline:” your milestones over time, now supporting scale breaks (e.g. for longer periods and intervals). The timeline looks more elegant now and it became even easier to create.
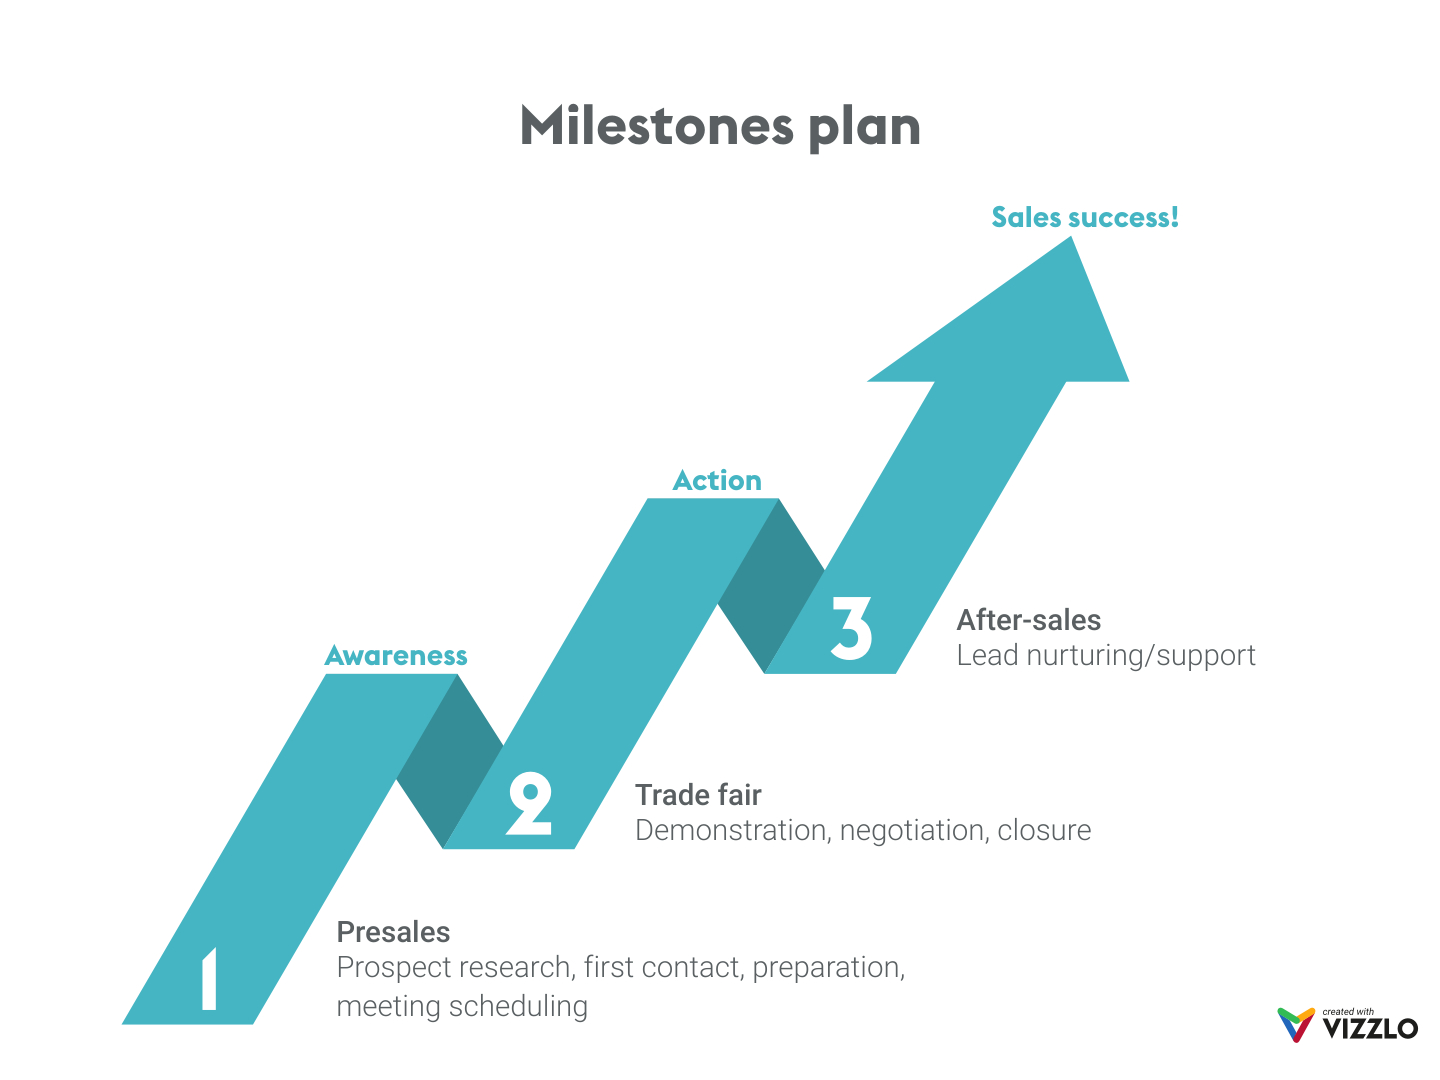
The “Milestones as Arrow” chart: set your milestones while conveying the idea of progress and growth.
We’re committed to continually enhancing our portfolio, as well as your experience as user. Soon we will show you new features that make working with Vizzlo within your organization even easier!
Note: On the landing pages of each chart, you’ll find a short description of all its functions. For the Gantt chart, we’ve already prepared a tutorial— but it’s so intuitive that you might not need it.
Create your charts with Vizzlo, present and impress!