Chart Vizzard
Vizzlo's AI-based chart generatorMarch 21, 2023 • 8 min read
Ten FAQs about Vizzlo for Google Slides 2.0 (Video)
After releasing Vizzlo for Google Slides 2.0, we got a lot of feedback from our users who asked both relevant and interesting questions. So we organized it a bit and asked our CEO Rob to answer to the 10 most frequently asked questions—and even made a video of it. It’s worth checking!
These are the questions and answers in written form.
FAQ #1: What’s the greatest feature in version 2 of Vizzlo’s Google Slides integration?
We introduced a bunch of small improvements like better performance, better usability, some really nice new illustrations and other things.
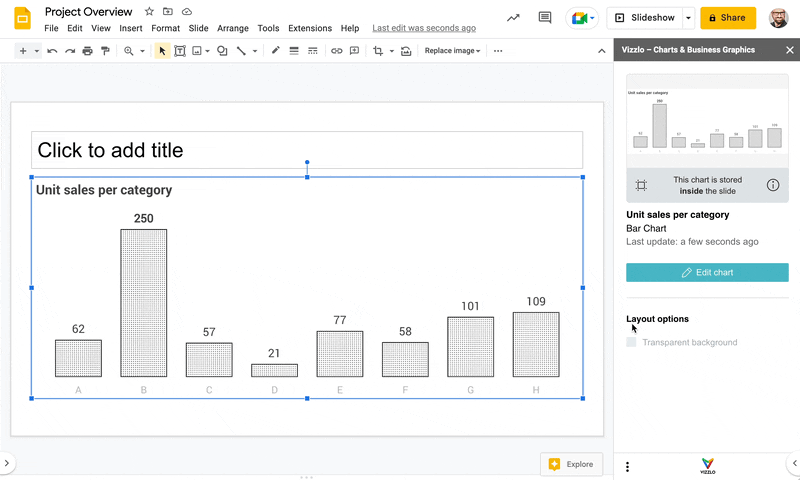
But the main thing, and that’s the reason why we call it version 2.0, is that we now support embedded charts. When working with embedded charts, the source for these visuals is stored within the slide directly in your presentation. So there’s no need to store a document on vizzlo.com and then link to these visuals, the actual content of these charts is stored within the presentation, is shared and copied, duplicated in all these things together with the presentation.
FAQ #2: What’s the difference between embedded and linked charts?
Well as I said before, an embedded chart is stored directly within the slide of your Google Slides presentation. So everyone with editing access to this presentation is able to fully modify the chart. And when you’re creating a copy of this chart, or of the slide, or of the presentation as a whole, you create an individual copy of this chart that can be modified without affecting the original source. And if you’re deleting an embedded chart, by deleting the chart, the slide, or even the whole presentation, it’s just gone, because there’s no copy stored anywhere else, it’s only within the presentation.
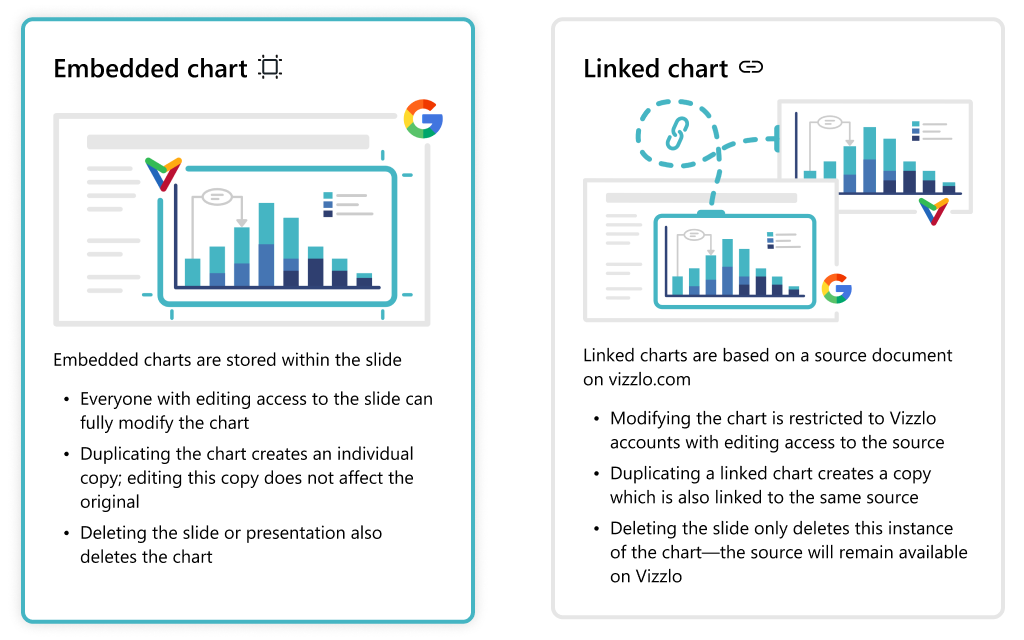
In contrast, linked charts are stored on vizzlo.com and only a visual representation of these charts is added to the Google Slides presentation, which means that if you create a copy of a Google Slides presentation that contains a linked chart, the copy will be linked to the same original source on vizzlo.com, and modifying one of the charts will impact on the copies. If you want to have somebody make modifications to linked charts, you need to give them access to the chart on vizzlo.com. If you delete a linked chart from a Google Slides presentation, or if you delete a slide or presentation that contains a linked chart, only the link will be gone. The original chart will still be stored on vizzlo.com.
FAQ #3: Can I use the same chart in more than one presentation?
Yes, it’s super easy to do this with linked charts. You just browse your existing charts using Vizzlo Add-on and insert the document as a linked chart in any of your presentations and you will have another visual representation of the same chart in another spot.
But you can also do this with embedded charts. They just won’t be connected because they are not linked charts. So just create a copy, use copy and paste, duplicate a slide, create a copy of the same presentation and you will have the same visual thing in multiple places without them being connected.
FAQ #4: What happens with my existing presentations?
That’s an easy one.
In all existing presentations created prior to this release, charts will just show up as linked charts, and you will be able to continue to use the exact same functionality as before.
Essentially we’re just using the same functionality that we offered before but now we are just calling it a linked chart.
FAQ #5: Can I convert my existing slides to use embedded charts?
Currently, there’s no automated way to do that.
But you can use any kind of visuals created on the Vizzlo platform, go to the editor and the file menu, and download the Vizzlo file- you can also do that from the export dialog. Then, just drop these Vizzlo files from your computer on a Google Slides presentation and the chart will be imported as an embedded chart.
That’s the way for you to convert charts in existing presentations into embedded charts.
We will certainly add some functionality to the add-on in the future for you to just click a button and convert any kind of linked chart into an embedded chart.
FAQ #6: How does sharing presentations work when using embedded charts?
Easy.
All you have to do is to share a presentation by any kind of means that you can find in Google Slides: create a sharing link, just copy the URL from your browser, use shared drives and Google drive. Whatever you currently use to share your presentations will work for sharing the charts within these presentations too.
There’s no need to give access to any kind of Vizzlo document on the Vizzlo platform to somebody who you want to invite, editing or commenting on these kinds of charts. Just share the presentation and if that person has access to the Vizzlo add-on, they will be able to edit the charts in this presentation. If you only give someone viewing access to any kind of presentation, that person won’t be able to update the charts, but still will be able to see them.
FAQ #7: What happened to document layouts?
Very nice question.
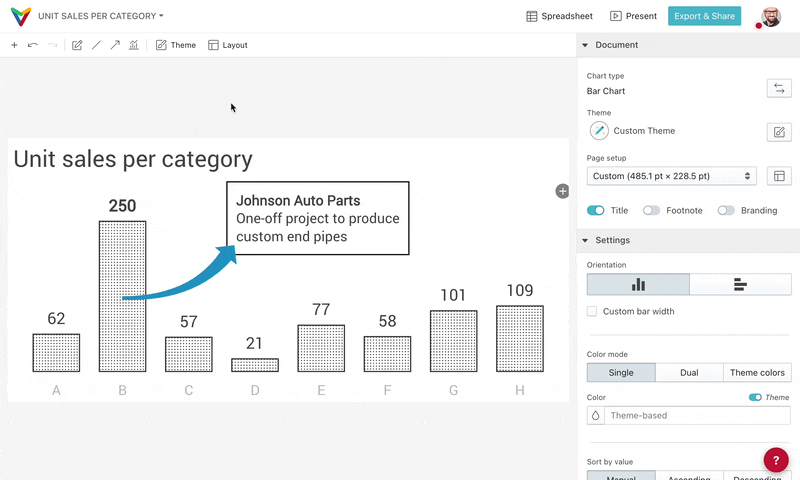
Document layout is the functionality in the Vizzlo platform to set the outer boundaries of the chart that you are creating. Since embedded charts have their whole visual stored within the slide, their size will correspond to the size of the graphic within the slide. So to set the boundaries, or edit a chart’s size, you just resize it in Google Slides and there’s no need to actually specify the width and the height of the chart in the Vizzlo editor.
And that’s why in the editor you won’t find the document layouts presets anymore. You only have the settings to change the margins. The size of a chart is set from within Google Slides itself.
FAQ #8: Can I connect embedded charts to remote data sources?
No you can’t.
For embedded charts we won’t be able to know where you actually store them. Thus, we can’t track the embedded charts in presentations and because of that,we are not able to update these charts whenever the original data source changes.
So if you want to make use of remote data sources of scheduled auto updates or manual auto updates based on changes in remote data sources, you have to use a linked chart.
FAQ #9: Can I collaborate with multiple people on the same presentation?
Yeah, that’s a functionality that Google Slides has offered for a long time. So you can even do real-time collaboration. You can see what others are doing in the presentation, and you can do the same thing with our charts.
You can make copies, move them around, resize them, all these kinds of things. The only point is that if multiple people open the Vizlo editor at the same time and make modifications to the exact same chart at the same time, the version that gets stored in the slides will be that of whomever is the last one to click the saving/close button in the top.
So you might want to use the history functionality of Google Slides to keep it under control if there’s too many changes at the same time.
FAQ #10: How are my presentations affected when canceling my subscription?
Very important question.
One of the basic guarantees that we make with Vizlo is that we won’t touch your presentations when you’re not there. So any change to the presentation that happens is only happening because you’re currently editing that from within Google Slides.
So if you cancel your subscription, we won’t be touching that presentation at all, so nothing changes there. This means you can continue to present with these presentations, you can continue to store them, duplicate them, move them around, and make changes to the presentation.
The only thing is if you have an embedded chart or even a linked chart within a presentation and you want to make a modification to the chart, if you want to update the data that you’re visualizing in the chart, or to make some visual changes to the theme that you’re using or any of these kind of things, you will get to see a watermark within this graph. You will still be able to use the history undo functionality to get back to an older state, but we won’t force you to keep the subscription running just to be able to continue to use this presentation.
So, delivering the same stuff that you added a long time ago is still going to be possible, but creating new stuff or making modifications, you will bring the watermark.
To try out Vizzlo for Google Slides yourself, simply install the add-on from the Google Workspace Marketplace: Vizzlo for Google Slides.
Admins of larger organizations are able to install the add-on for all users.
If you would like to learn more about this integration or want to join a demo for your organization, please get in touch with us via our contact form.