Chart Vizzard
Vizzlo's AI-based chart generatorMarch 14, 2023 • 3 min read
Introducing Vizzlo for Google Slides 2.0
TL;DR: Vizzlo for Google Slides now allows creating embedded charts which are stored inside the presentation itself.
When we first set out to integrate the Vizzlo technology into Google Slides in 2018, our goal was to make it as easy as possible for existing Vizzlo users to add visuals they had created using our tool to their presentations.
Vizzlo’s editor already supported exporting charts into image files and our users had happily dragged them directly from the export dialog onto their slides:
Over time, and as more companies moved away from PowerPoint and started using Google Slides instead, we got a boatload of feature requests to help them replace their use of legacy tools, like think-cell: We added data-sync, automatic relayouting, new chart types, highly customizable number formatting, additional chart features, and a bunch of other things to make it easier to use Vizzlo from inside Google’s tool.
Alas, due to a limitation in the Slides API, one obstacle remained: Why would it be necessary to create and store any charts on the Vizzlo servers, when the visuals would only be necessary inside a single presentation? Why not store them directly in the slide—just like it is possible in Vizzlo for PowerPoint?
Today, we’re happy to announce that we have solved this problem and that Vizzlo for Google Slides 2.0 allows creating embedded charts which are stored inside the presentation itself.
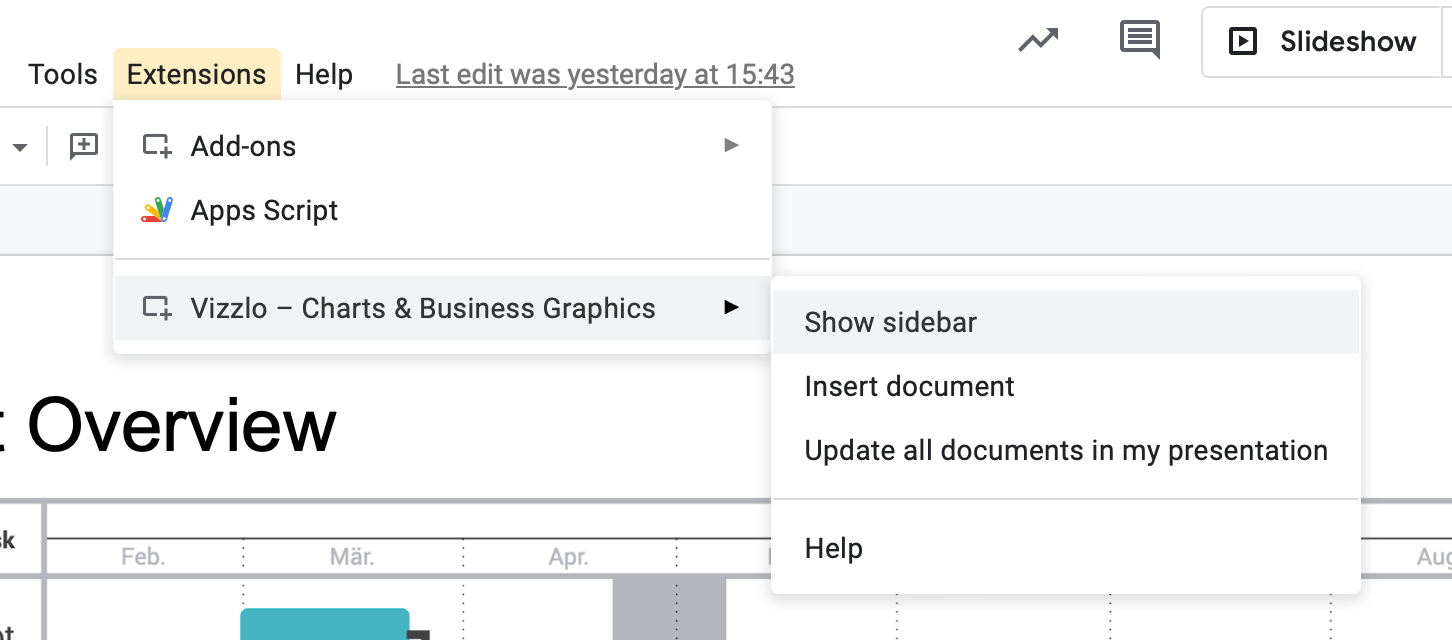
Vizzlo for Google Slides: Features
This new version of the add-on allows you to:
- Create embedded charts directly from within Google Slides and store the visualized data inside the presentation itself;
- Create linked charts which are stored on vizzlo.com and can be updated from within the presentation;
- Connect linked charts to data sources like Google Sheets or Excel and CSV files stored in Box, Dropbox, Google Drive, or OneDrive;
- Use all of the 120+ different chart types available in our portfolio;
- Add custom chart features, like benchmark lines, level difference arrows, projections, CAGR calculations, and more;
- Share & export the Google Slides presentations with the charts included.
Vizzlo for Google Slides: Installation
Individual users can simply install the add-on from the Google Workspace Marketplace: Vizzlo for Google Slides.
Admins of larger organizations are able to install the add-on for all users.
If you would like to learn more about this integration or want to join a demo for your organization, please get in touch with us via our contact form.