Chart Vizzard
Vizzlo's AI-based chart generatorPictograph
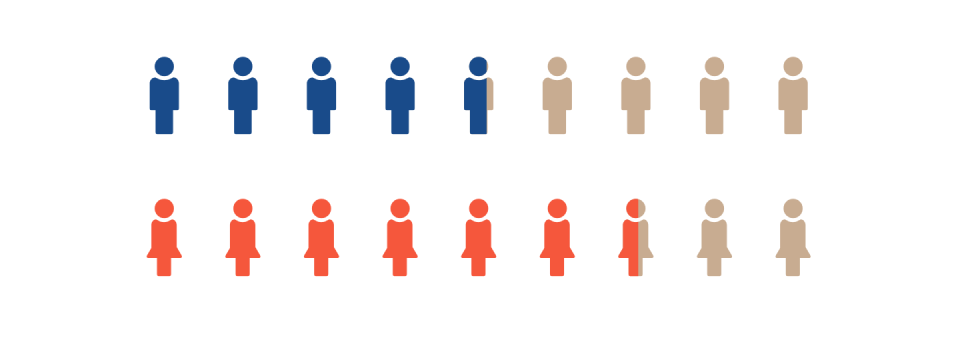
Visualize and compare percentages, fractions or absolute numbers with engaging icons.


What is a pictograph?
The pictograph uses universal symbols/icons to visualize, highlight and compare percentages, fractions, and absolute numbers. This chart is also known as “ISOTYPE chart” or “Neurath chart.”
The social scientist and scientific philosopher Otto Neurath (1882-1945) developed the ISOTYPE language (International System of Typographic Picture Education) and the “Vienna Method” of picture statistics during his work at Social and Economic Museum of Vienna in the interwar period. This method was designed to be highly comprehensible, having the “visual education” and the easy interpretation of information as its guiding principles.
Today, pictographs are frequently used in the news and social media infographics to provide a quick and easy-to-read overview of different topics.
In this vizzard, you can plot multiple sets of icons to compare different types of data. You can mix and match icons and comparison modes to display key facts and figures, compare parts to whole or sets against each other.
Best uses for the pictograph
- Making simple data more interesting
- Presentations for consumers
- Communicating data in editorial articles
How to make a pictograph with Vizzlo?
Use icons to visualize your data and create stunning, intelligible charts. Follow these easy steps:
- Click on the elements to edit them: right-click to choose the icon type and the comparison mode (i.e., percentage, fraction or absolute numbers)–alternatively, use the active cards in the sidebar to set all your preferences at once
- Use the “plus” handles on the sides of each box to add further sets
- Use the slider to adjust the sizes of the icons
- Drag a legend around its set to redefine the legends’ position in your chart
- Drag and drop sets to reposition them. Or, on the tab “APPEARANCE,” of the sidebar choose how to sort them
- Explore the Vizzlo themes or customize your own, selecting colors and fonts
pictograph: pro tips
- Set the document size before starting to design your chart (in the tab “APPEARANCE” of the sidebar)
- If you’re planning to use it in your presentation slides, try creating this and other hundred charts and graphics directly in PowerPoint or Google Slides using Vizzlo’s integrations
- Pictographs work best for part-to-whole comparisons–percentages and fractions having the most impact
- The more fun designs shouldn’t distract from the meaning of your data–so use this chart only when your data is clear and simple
pictograph maker: key features
- Up to nine sets
- Icon types: cocktail, female, gift, male, palm, snowflake, sun, tree
- Custom (per series) comparison mode: percentage, fractions or absolute numbers
- Custom legend position
- Optional automatically sorting: by value; top to bottom and side by side
- Custom color and fonts
Pictograph: What's new?
You can now use ☆☆☆ on your Pictograph.
Tiny improvement to avoid confusion - no negative values are allowed anymore when change the number of icons.
Fractions will be shown correctly up to the nth decimal place.
Pictograph Alternatives


Enhance your productivity
Create a Pictograph directly in the tools you love

Create a Pictograph in PowerPoint with
Vizzlo's add-in

Loved by professionals around the world


Visualizations your audience won’t forget
Convey abstract concepts and data with professionally designed
charts and graphics you can easily edit and customize.