Chart Vizzard
Vizzlo's AI-based chart generatorValue Projection
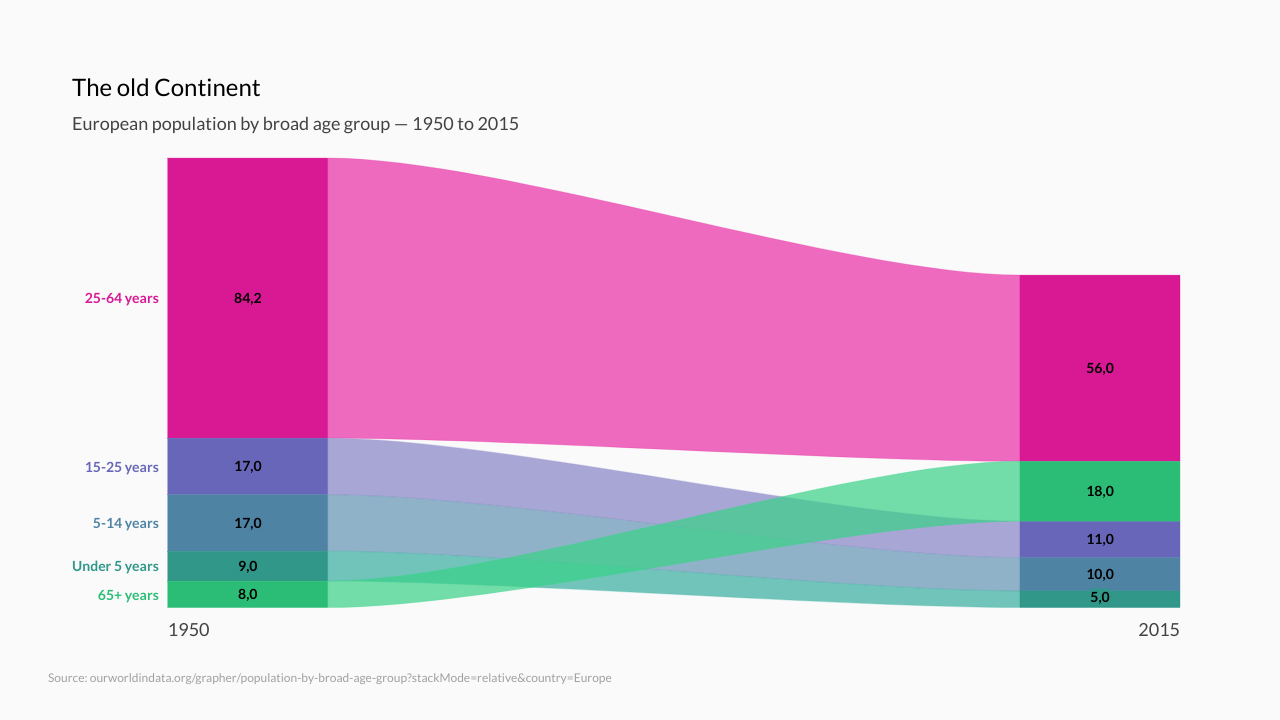
Use a value projection to compare the values of different categories in two different moments.


What is a value projection chart?
A value projection is a chart that represents the proportions of parts of a whole in two different moments.
Use this visualization to display changes in the composition of market shares or demographic data, or to measure your achievements comparing your targets with your actual performance, for example.
How to make a value projection with Vizzlo?
- Use the spreadsheet to insert your data
- Alternatively, you can create new categories from the button “Add record”
- Select a category to edit the start and the end value
- Explore additional customization options in the sidebar or in the theme settings
Features
- Up to 8 available entries
- Show values in absolute and percentage mode
- Sort values by their size
Value Projection: What's new?
These chart types now all support adding custom formatting to individual value labels.
NEW You can now add sum labels to the chart.
There is a new option for each selected category to overwrite its color.
It is possible now to display up to 20 series with this chart.
NEW We added a few styling options to our Value Projection. Now you can:
- display values in absolute and percentage mode
- show the category labels above or below the chart (or hide them)
- change the color of the record labels
- change the font style of the category and record labels
- change the layout of the chart itself
Value Projection Alternatives
Enhance your productivity
Create a Value Projection directly in the tools you love

Create a Value Projection in PowerPoint with
Vizzlo's add-in

Loved by professionals around the world


Visualizations your audience won’t forget
Convey abstract concepts and data with professionally designed
charts and graphics you can easily edit and customize.