Chart Vizzard
Vizzlos KI-basierter Diagramm-GeneratorThe Evolution of the Global Smartphone Market
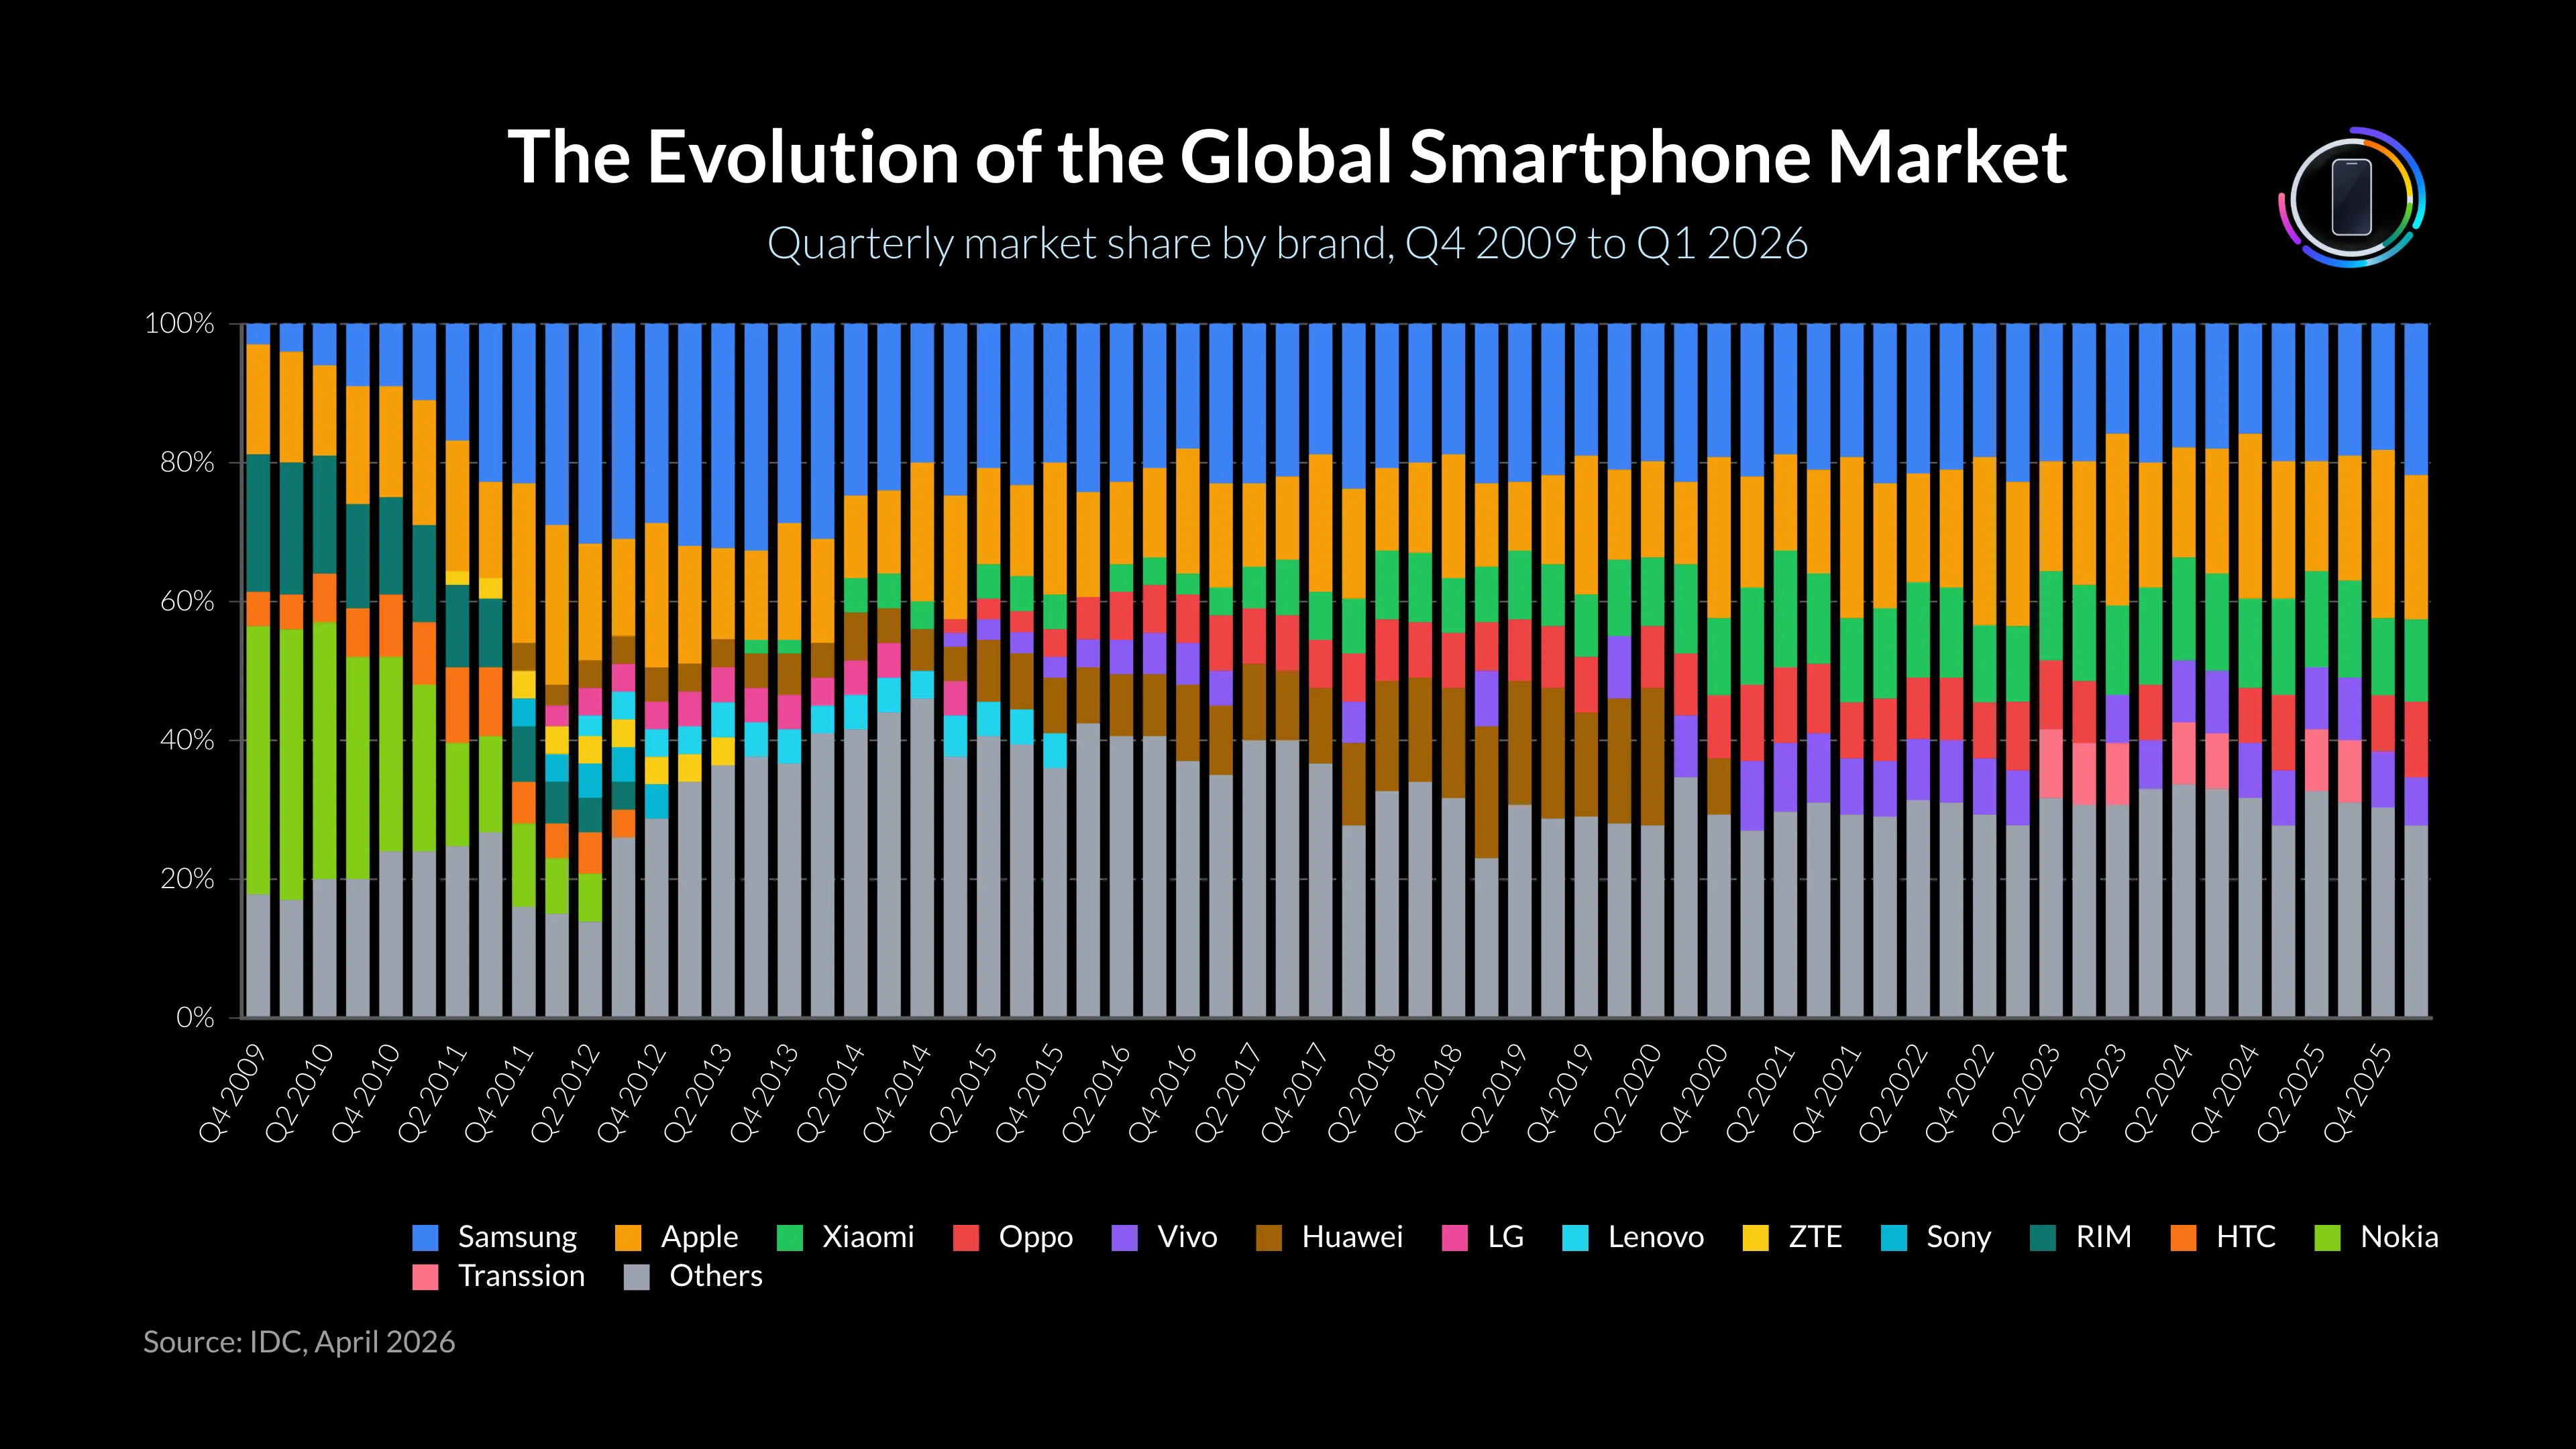
Global Smartphone Market Share by Brand (Q4 2009–Q1 2026) is a 100% stacked bar chart that visualizes how worldwide smartphone market share shifted among major vendors, including Samsung, Apple, Xiaomi, Oppo, Vivo, Huawei, Nokia, LG, Lenovo, Sony, HTC, RIM, Transsion, and others. The chart captures more than 16 years of quarterly market evolution, from Nokia’s early dominance to a market increasingly led by Samsung, Apple, and major Chinese manufacturers.
The visualization highlights several major changes in the competitive landscape. Nokia held 39% of the global smartphone market in Q4 2009 but declined rapidly as Android and iOS devices gained adoption. Samsung expanded strongly during the early 2010s, while Apple maintained a significant share throughout the period, with particularly strong results in many fourth quarters. Huawei grew rapidly during the second half of the 2010s before declining after 2020, while Xiaomi, Oppo, Vivo, and later Transsion became increasingly important competitors.
By showing each quarter as a bar normalized to 100%, the chart makes it easy to compare how the composition of the smartphone market changed over time and how individual brands gained or lost share. 100% stacked bar charts are particularly useful for visualizing changes in market structure, competitive positioning, category composition, and other datasets where the relative contribution of multiple groups over time is the main focus. The “Others” category may include different vendors in each quarter, as IDC reports only the leading vendors for each period.
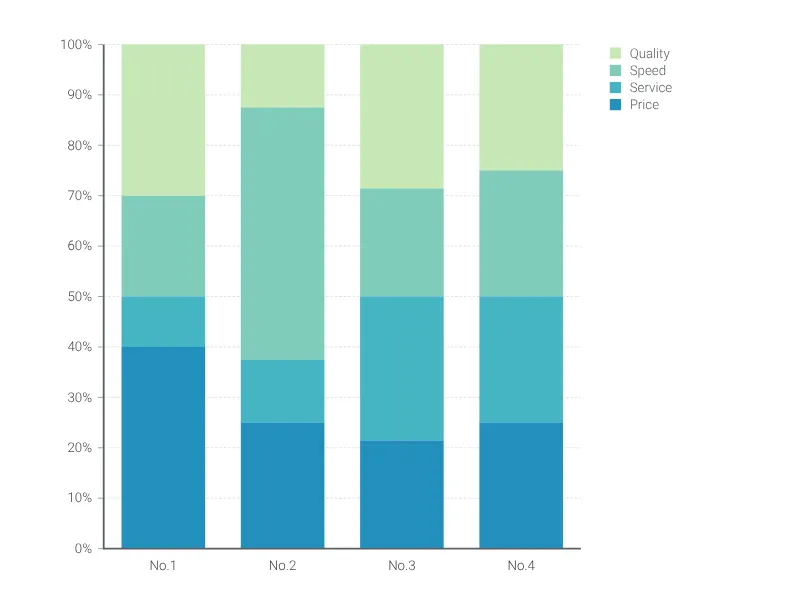
Dies ist ein Beispiel für Vizzlos "100% gestapeltes Balkendiagramm"
Erstellen Sie ein gestapeltes Balkendiagramm, das sich zu 100% aufaddiert.