Fill out the form, and we'll get in touch as soon as possible.
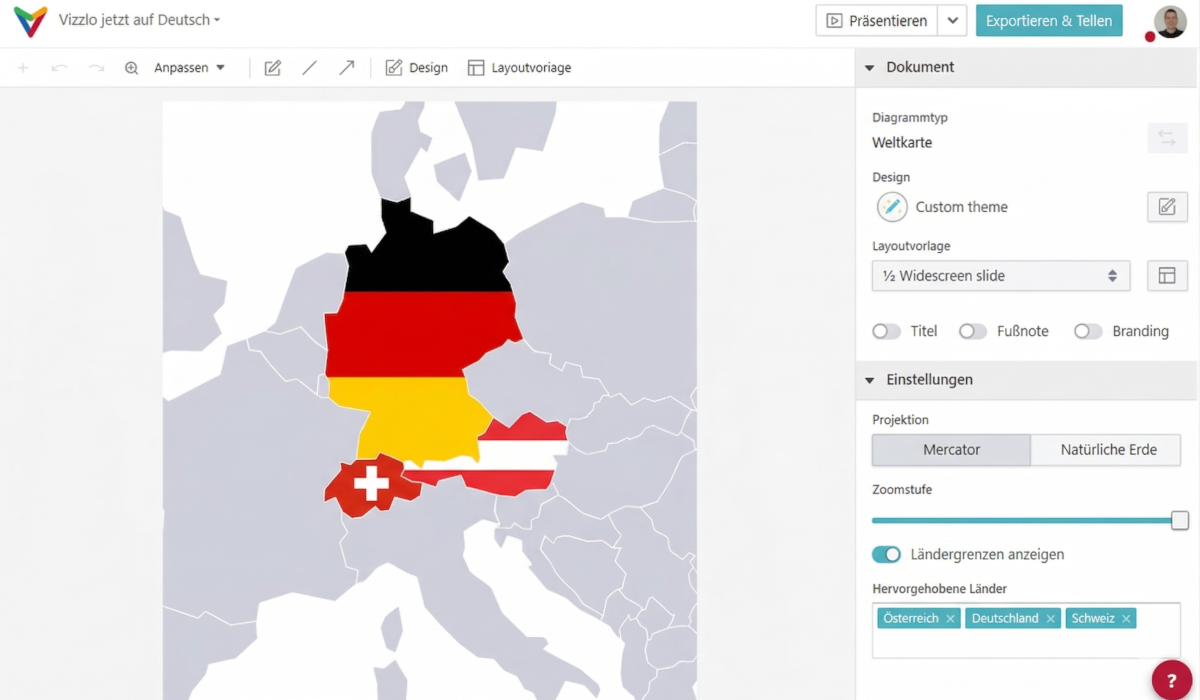
Gute Nachrichten for our German-speaking users — Vizzlo is now fully available in German.
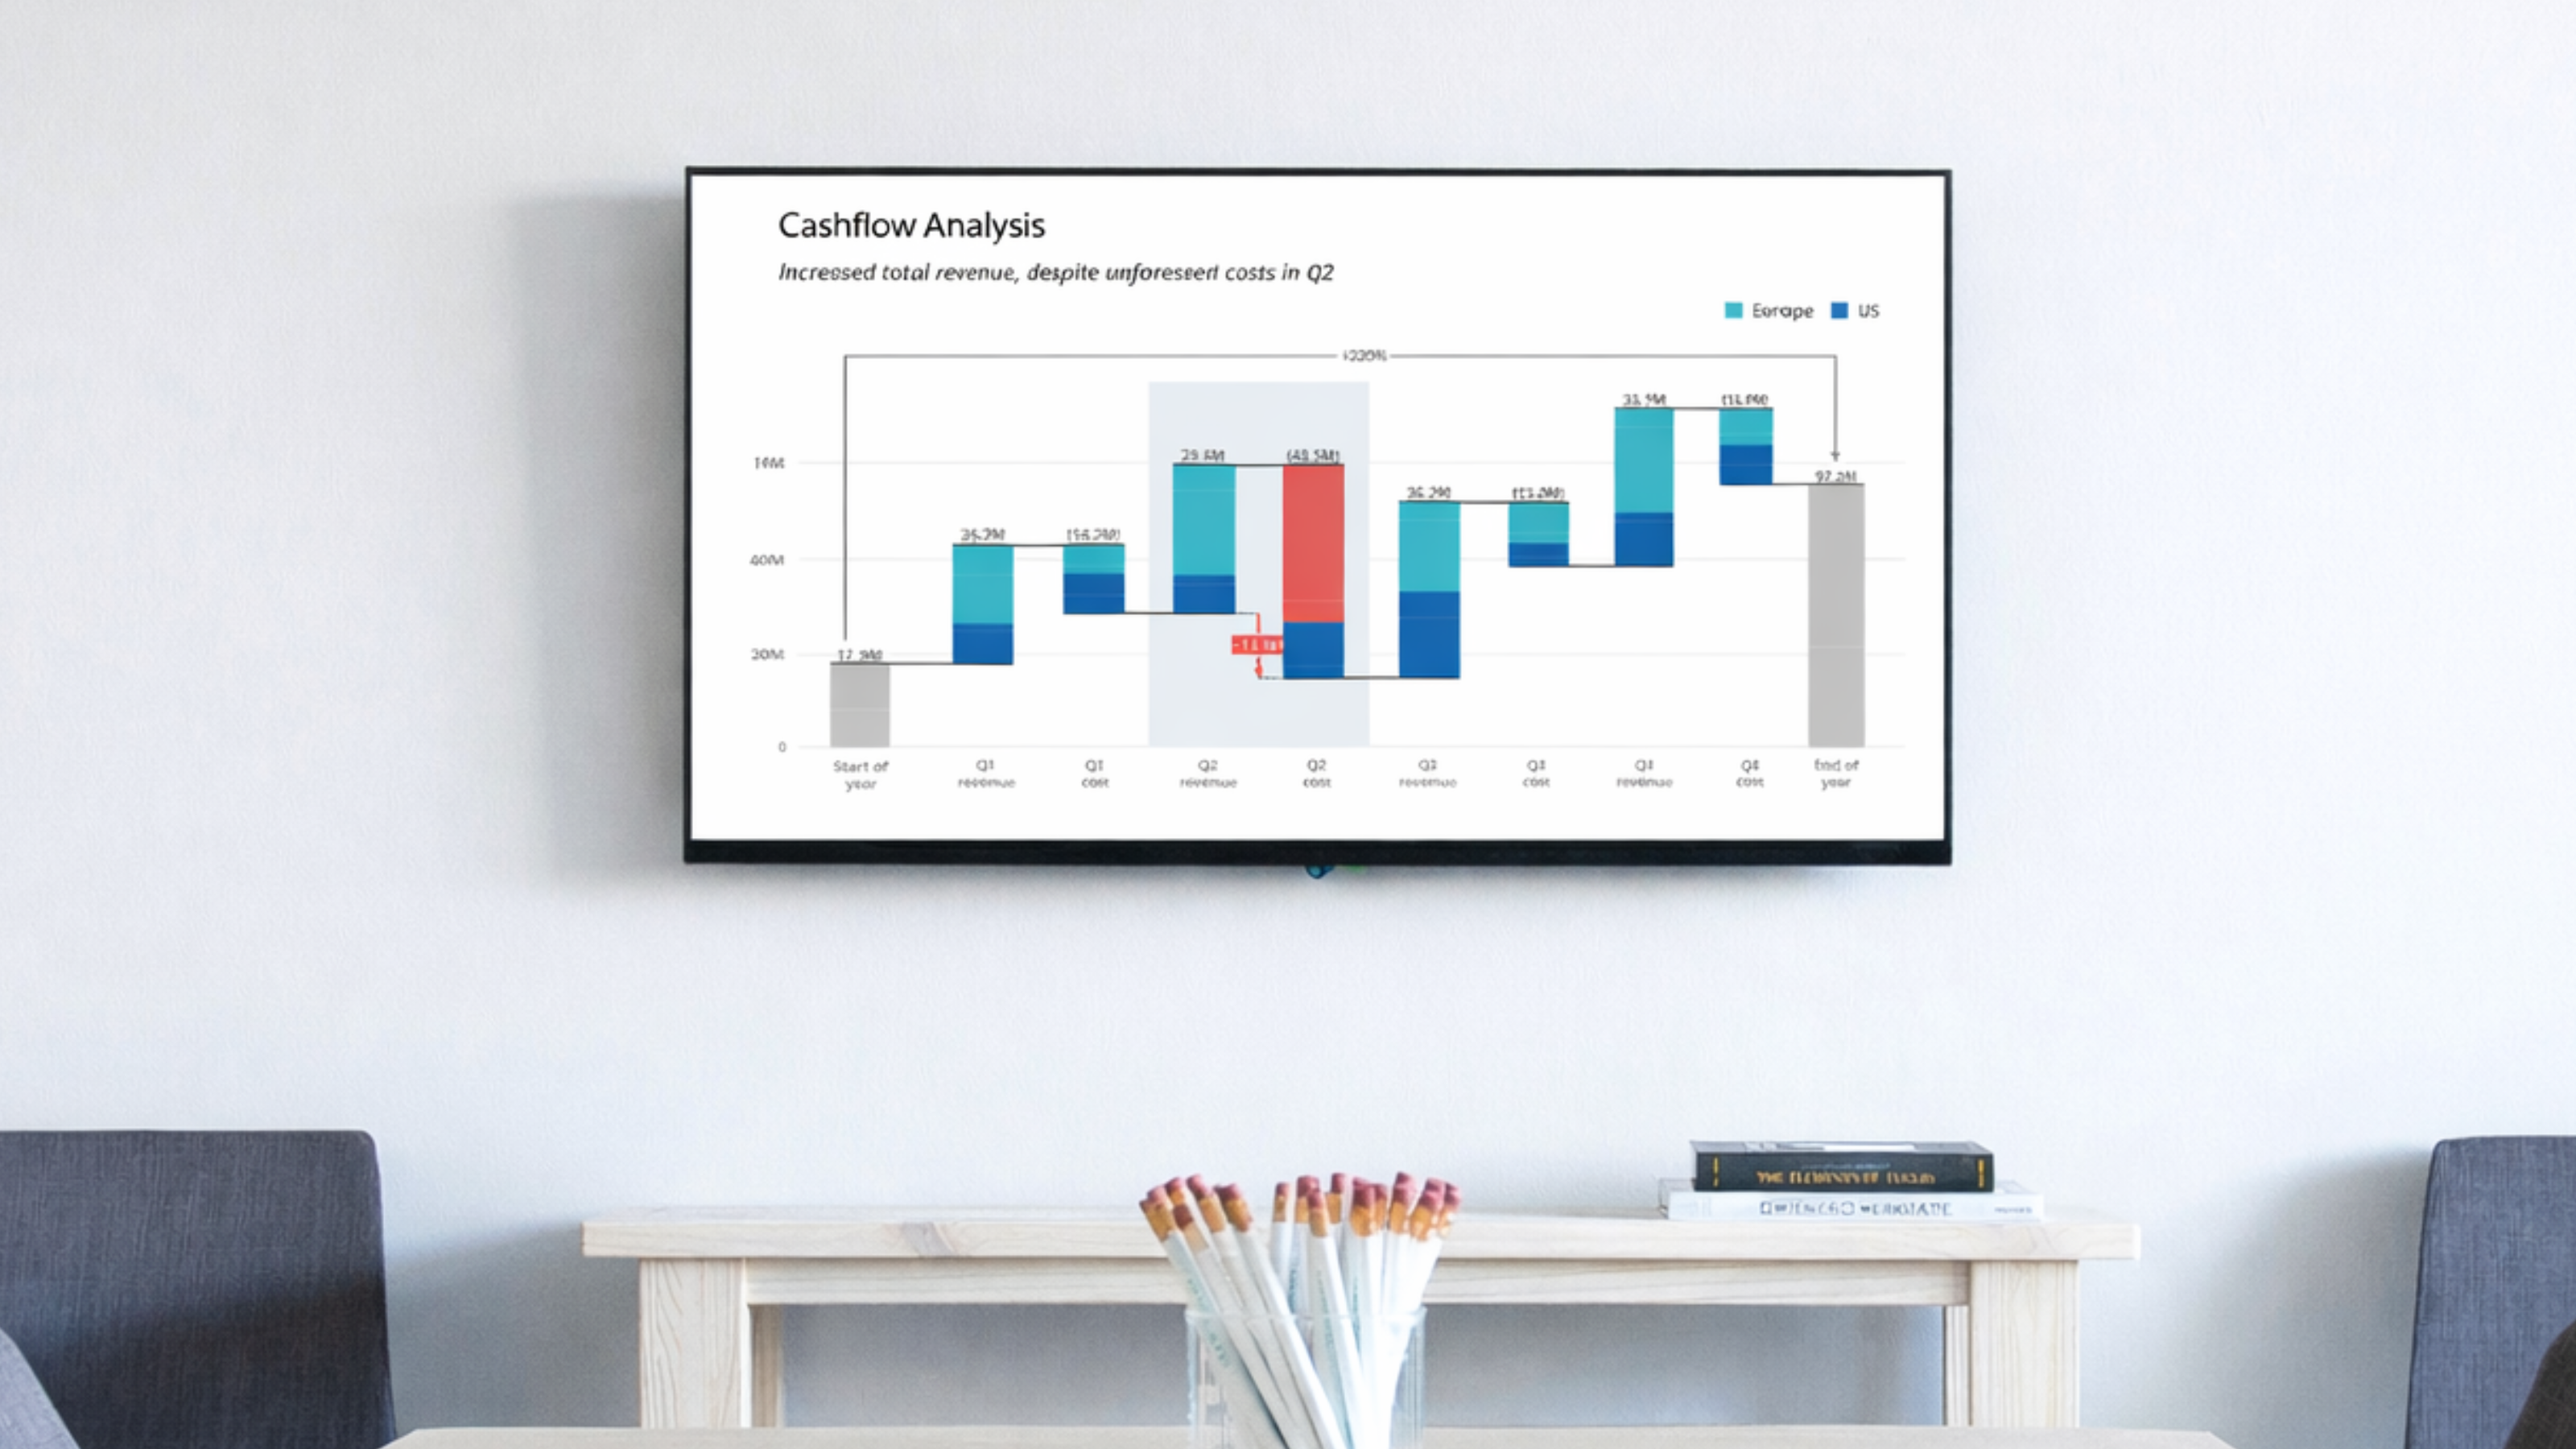
Vizzlo Cast allows streaming any chart with live updates to your Office TV screens.
We're making all new Vizzlo charts private by default for everyone—including free accounts—to eliminate confusion about document privacy settings.
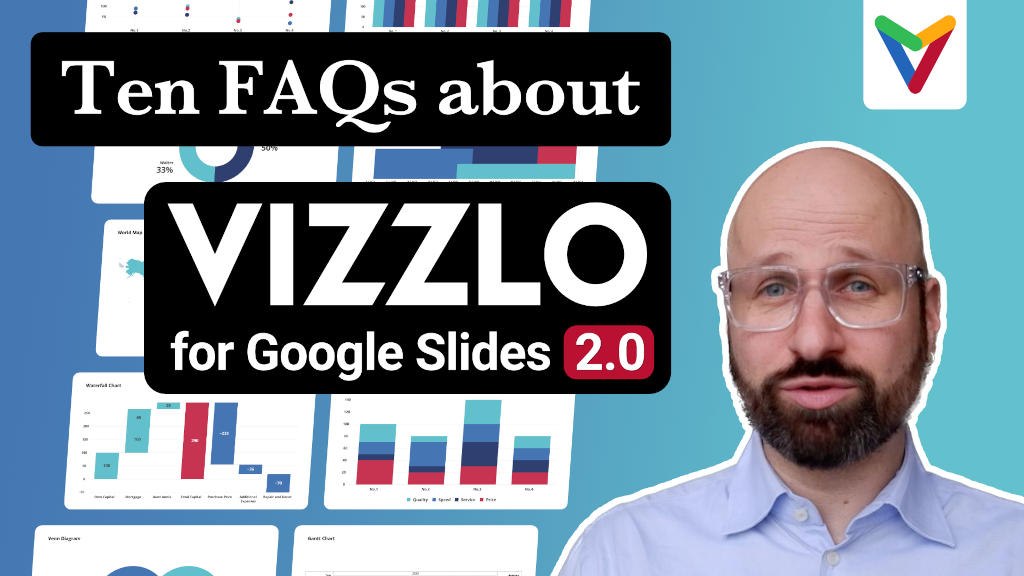
We asked our CEO to answer the most frequently asked questions about Vizzlo for Google Slides 2.0—and hit record.
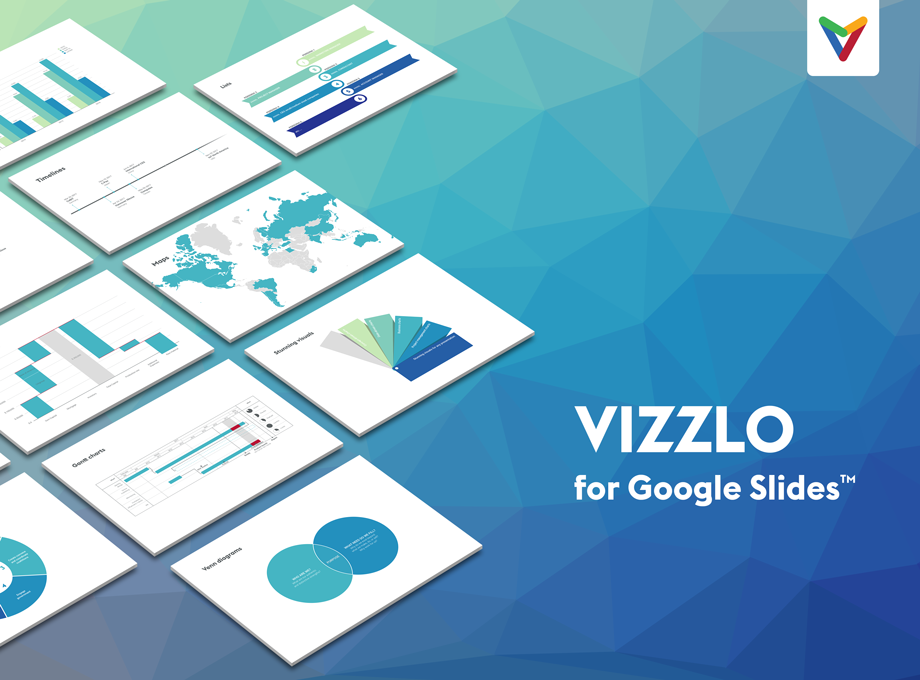
Vizzlo for Google Slides now allows creating embedded charts which are stored inside the presentation itself.
Why are Google Slides presentations not compatible with PowerPoint presentations?
Visual communication brings light to facts in the age of misinformation.
The finance sector needs change, fast.
Spot trends, communicate fast, exceed your goals
It seems like we’re learning new buzzwords every month or so, but ‘dataviz’ has been in the air for a while now and with Google’s release...
Rome wasn’t built in a day, but effective planning and realistic goals will help you close your projects faster than ever.
Or so the new wave of high-paid data viz experts want you to think…
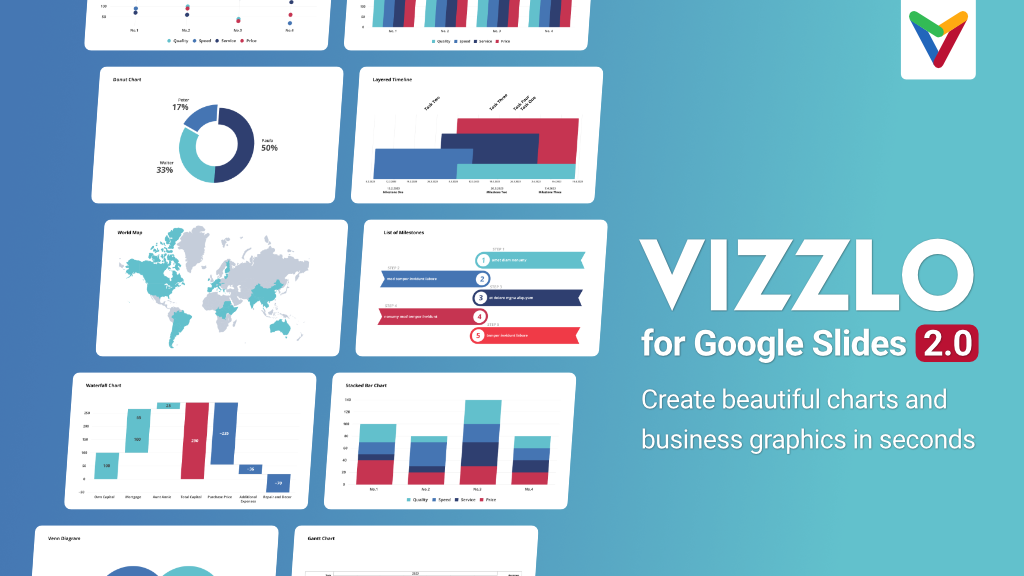
100+ different diagrams and business visualizations are now available right inside your favorite presentation program
Pie Charts are not going anywhere, we might as well learn how to use them correctly.
How often have you wanted to visualize your business strategy and spent more time finding the right way to chart it, instead of working on your project?
And a brief 2017 recap (or why Vizzlo had a fantastic year)
New charts, a holiday theme, and magic…
Get to know Vizzlo’s new PowerPoint add-in
That wall full of sticky notes looks great, but it can...
Choose the best visualization type for your data
On the endless search for becoming better
Preparing presentations together with your team just became easier.
Portfolio enhancements to power your presentations!