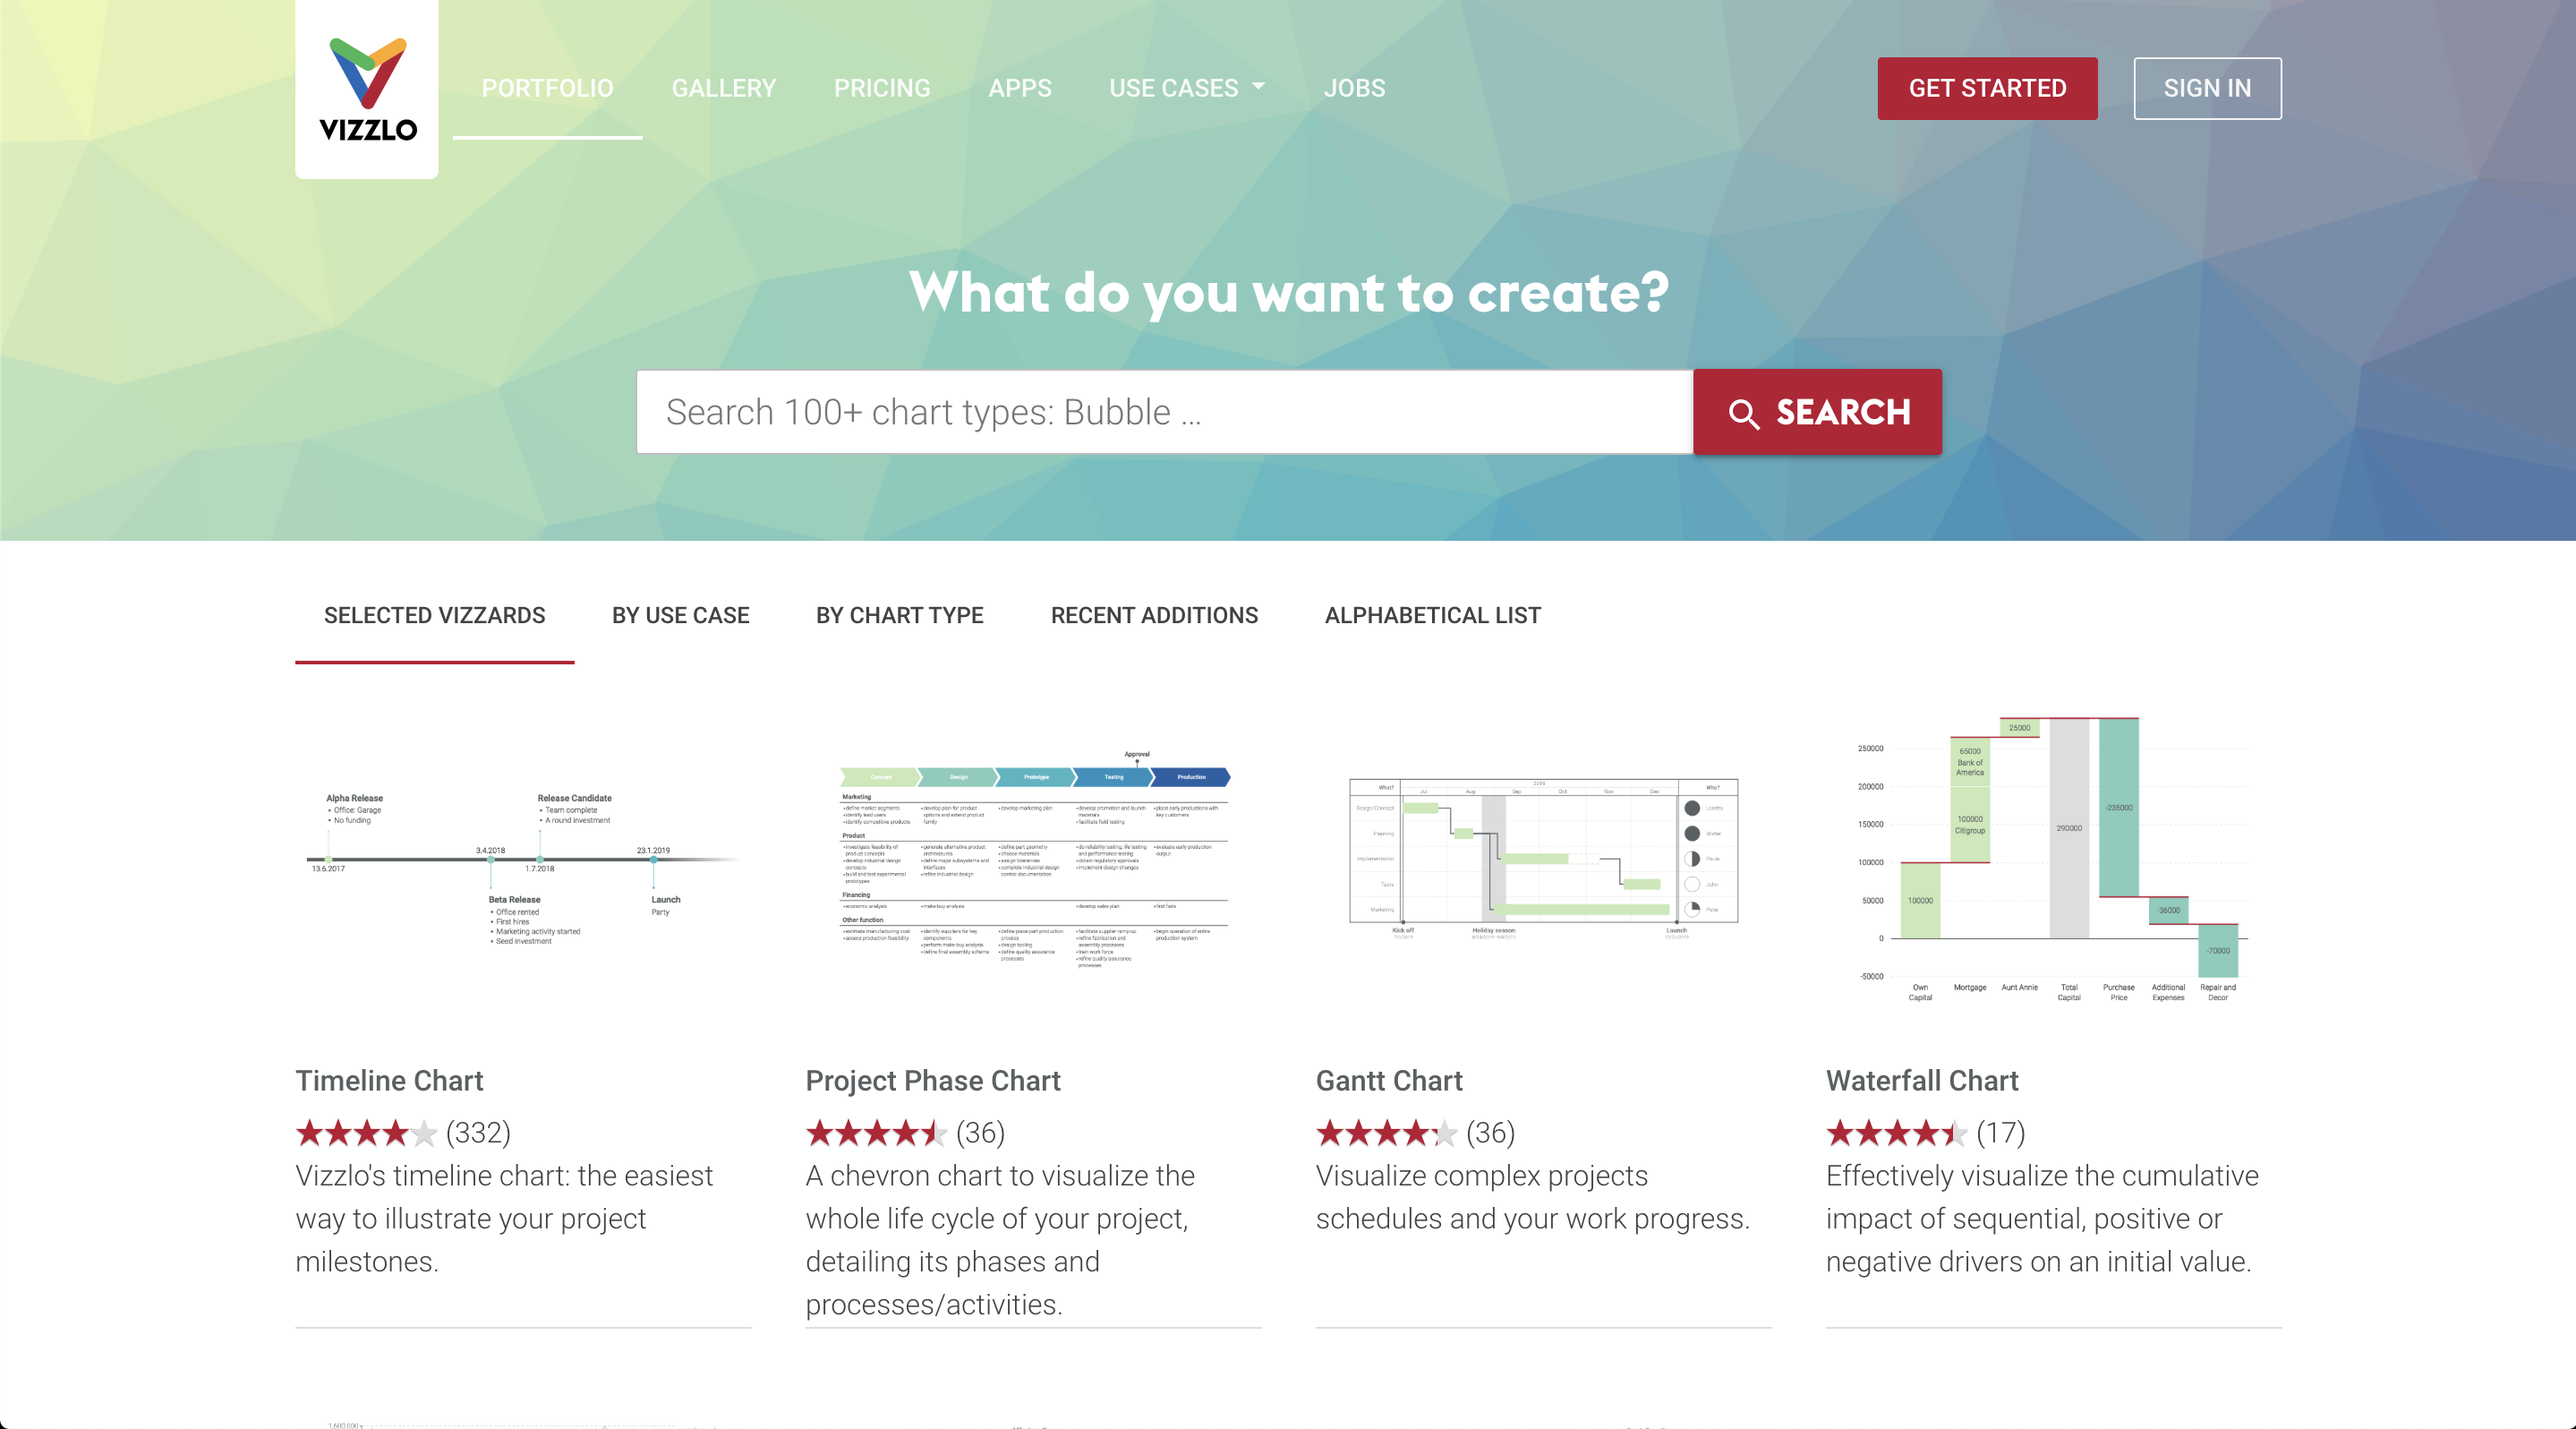
PREVIEW
Chart Vizzard
Vizzlo's AI-based chart generatorData Viz Guide
Learn to visualize data and create beautiful charts. Choose the right visualization type–get inspired by the best practices and avoid common pitfalls.
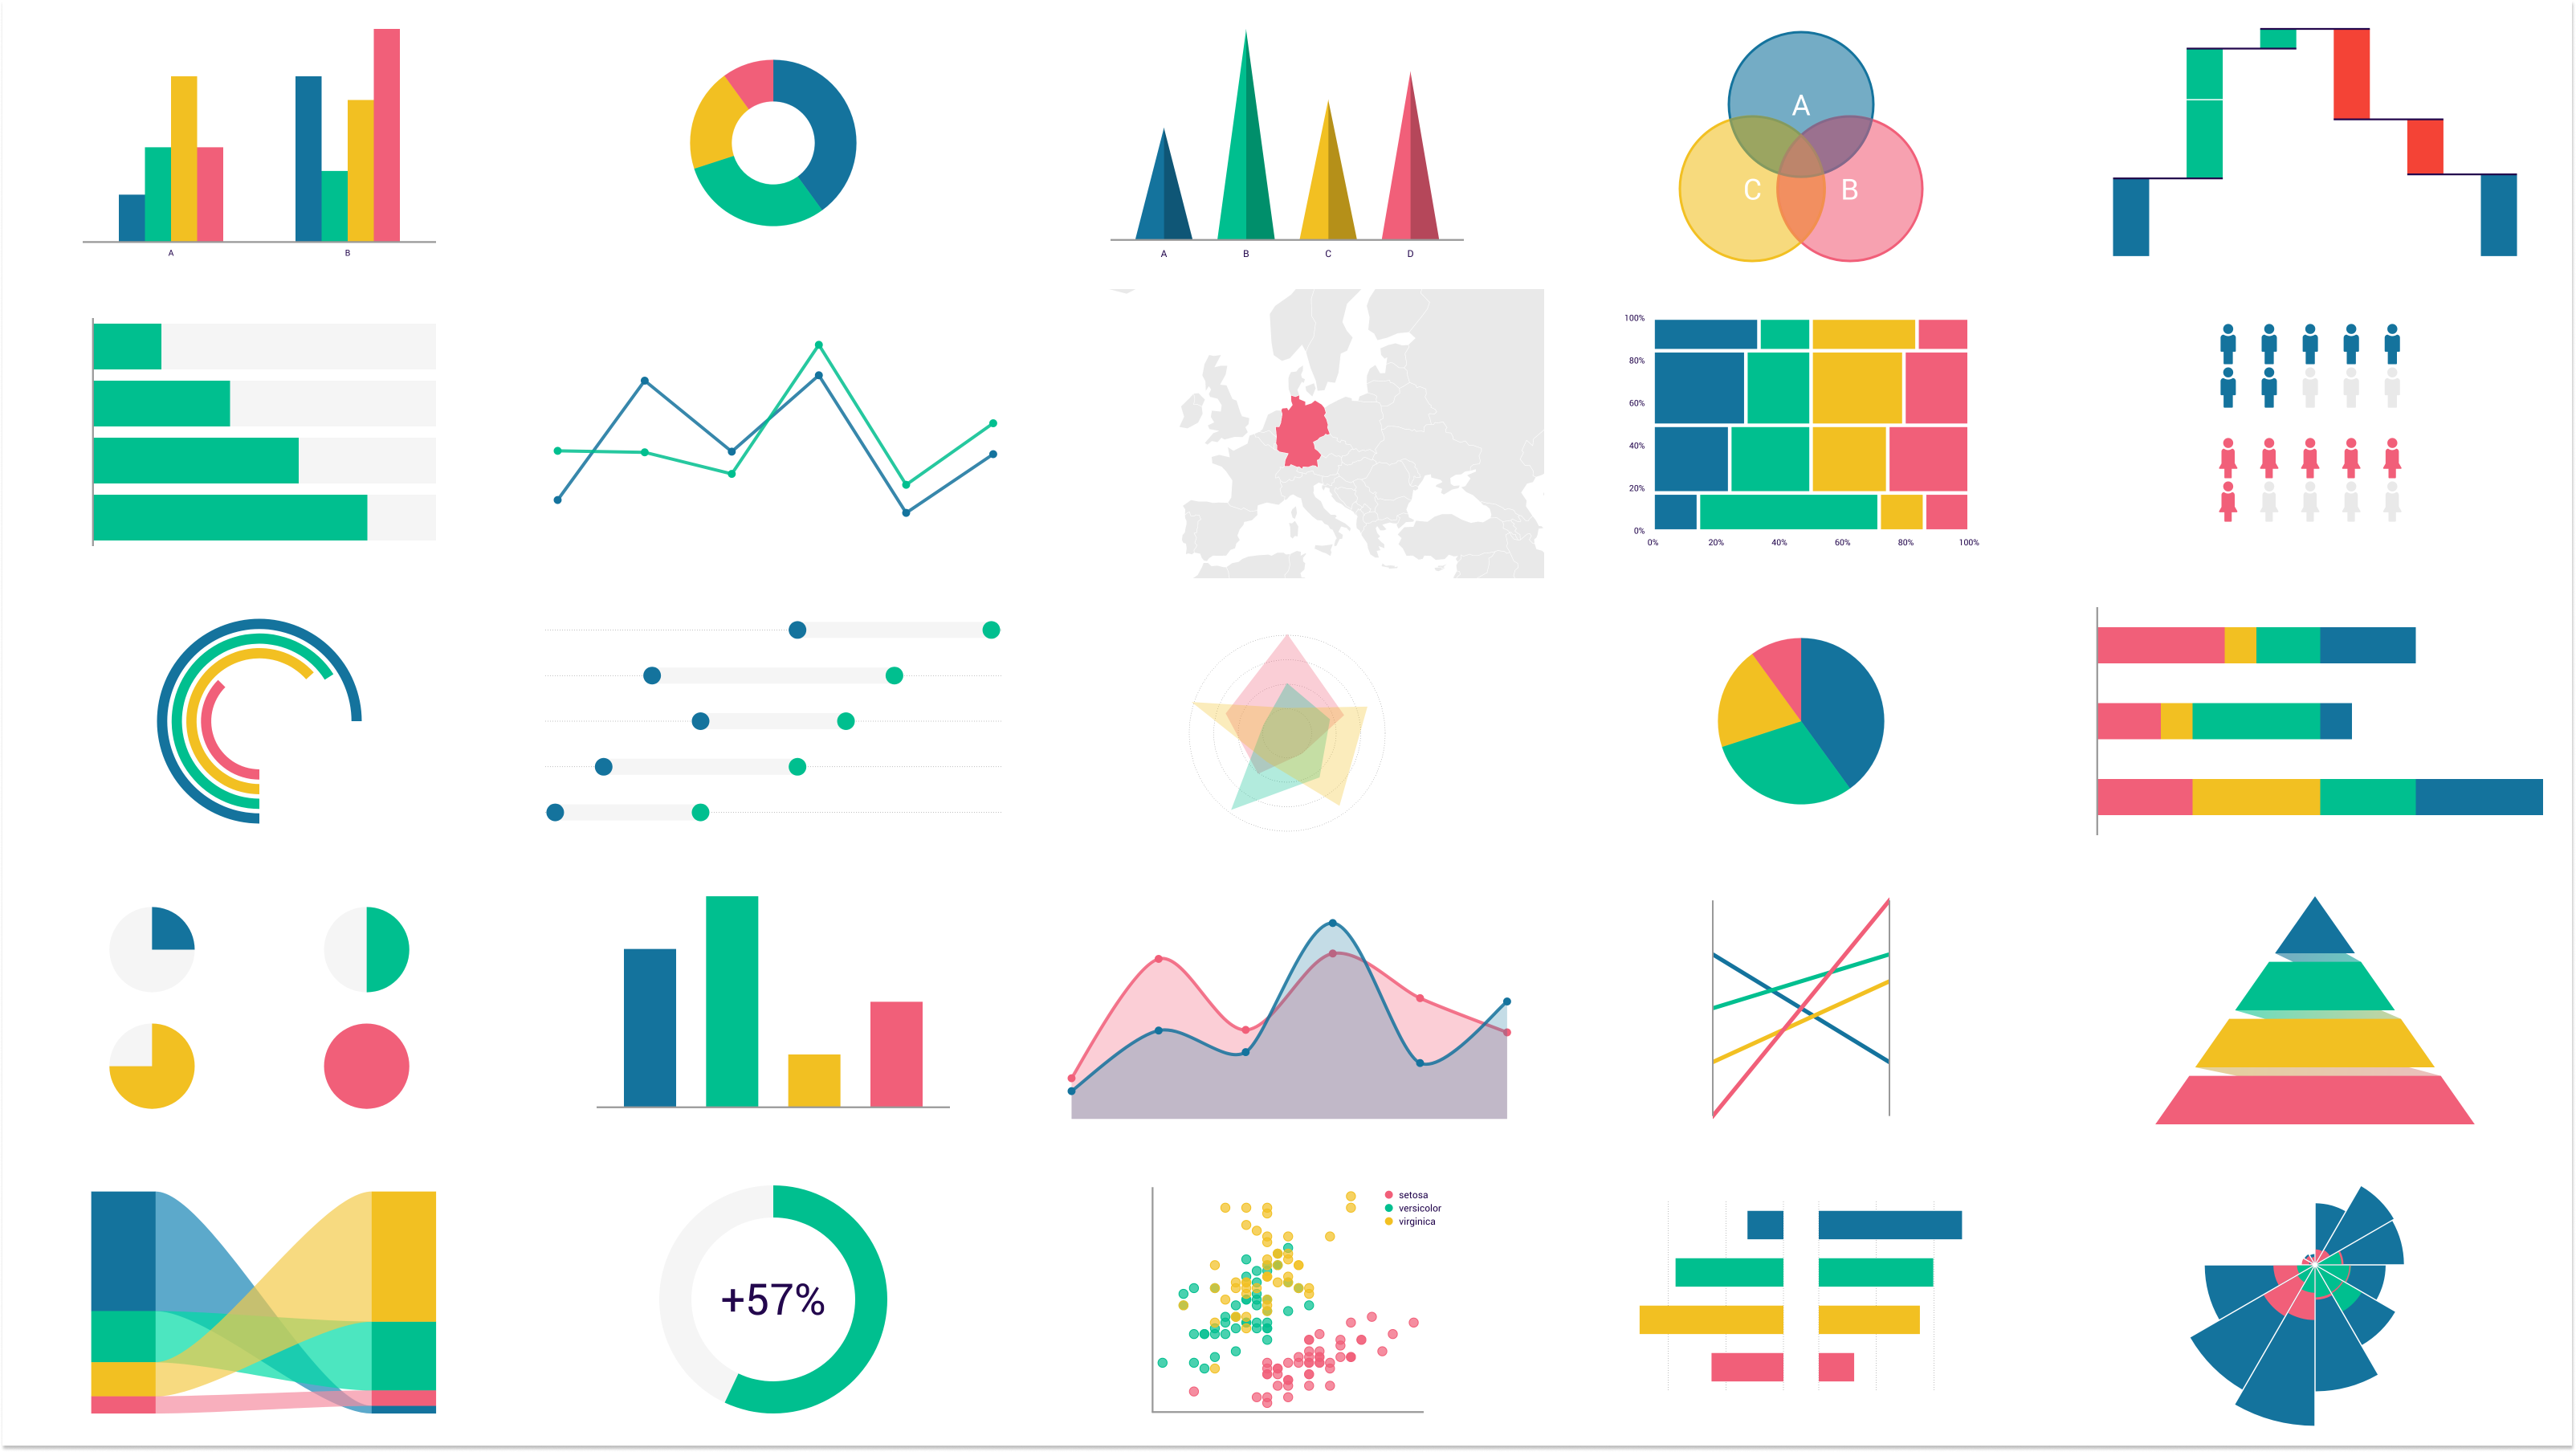
Bar Charts


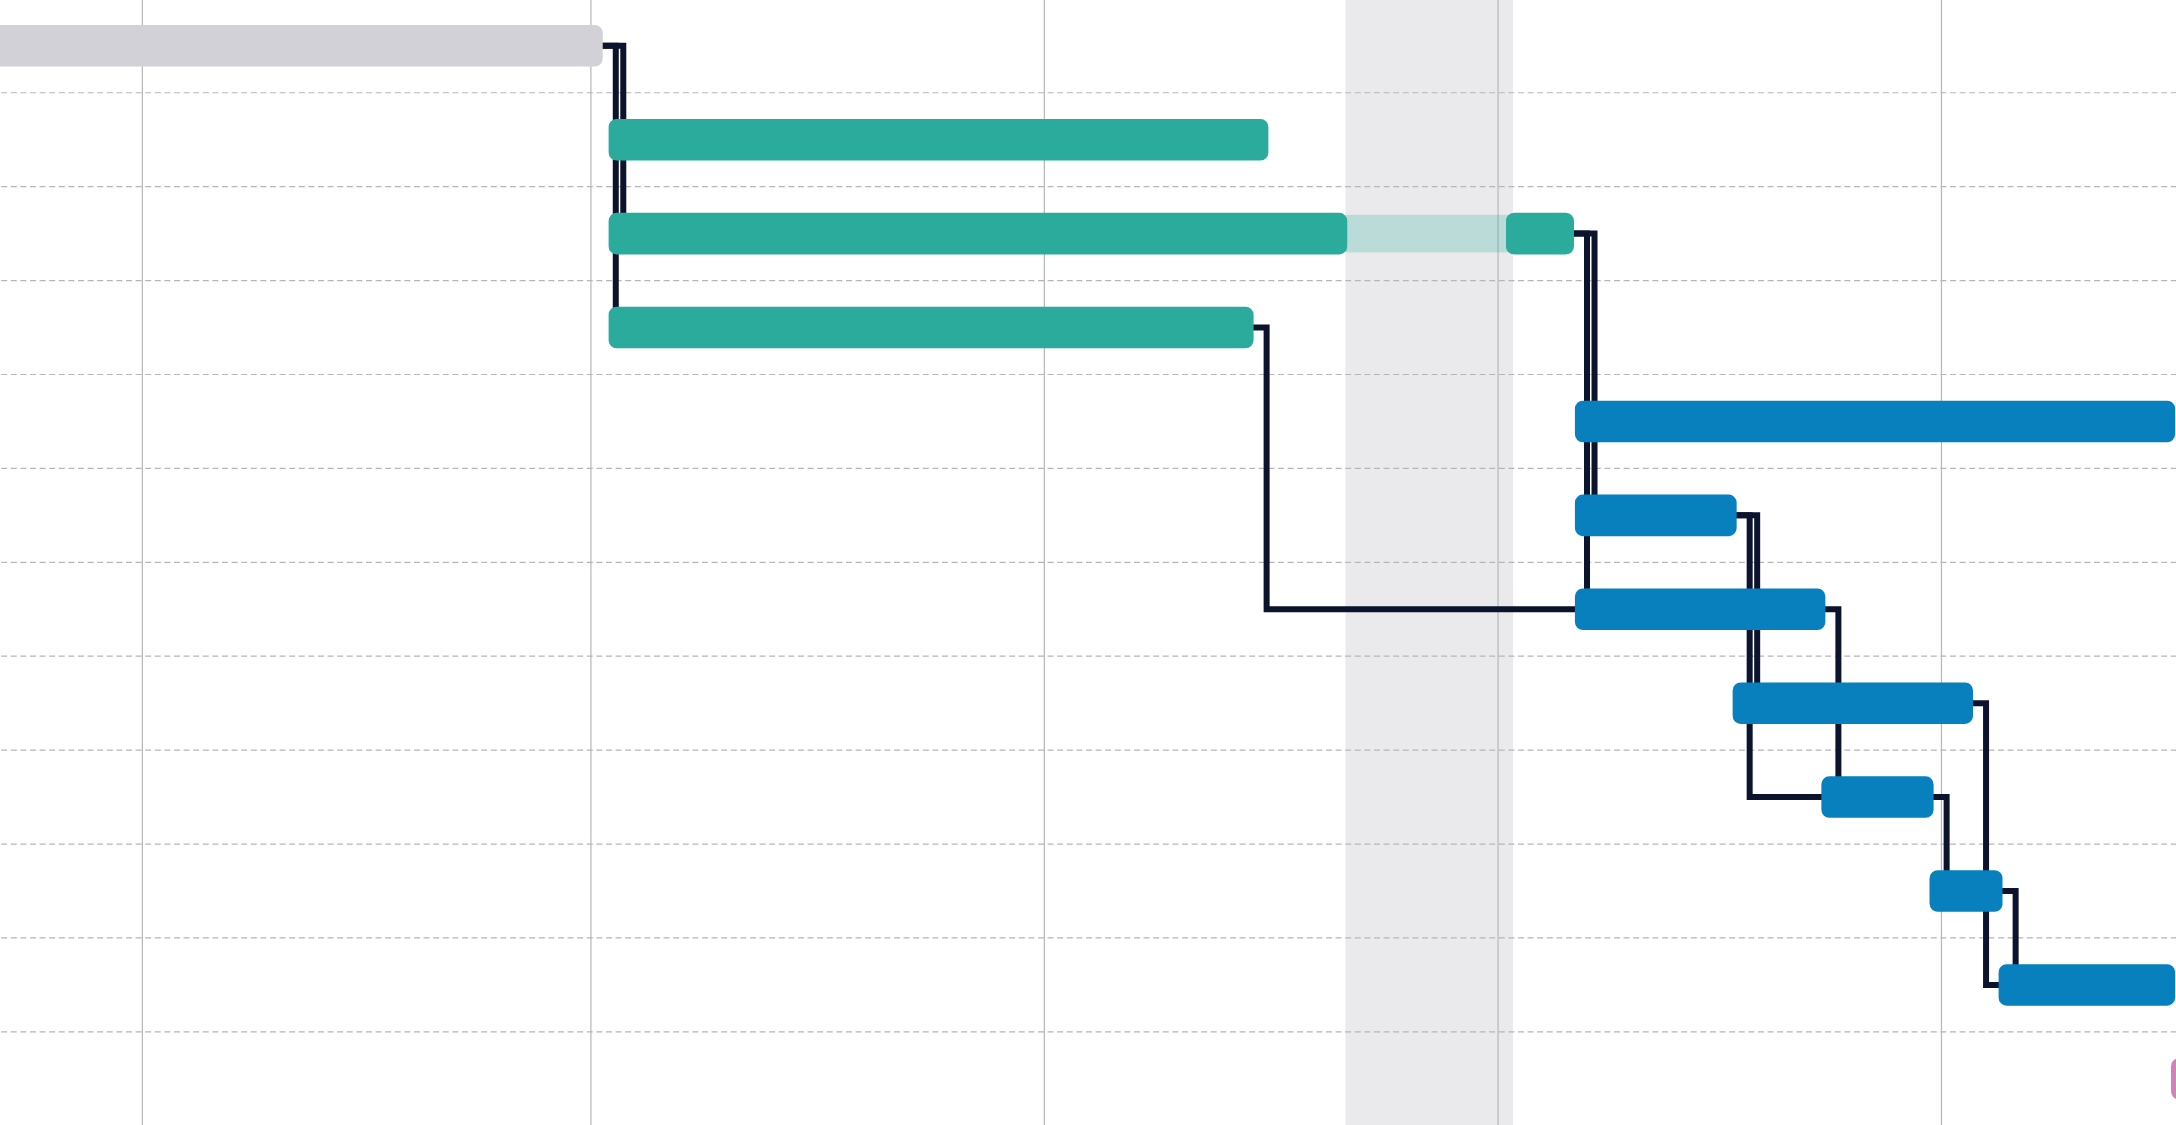
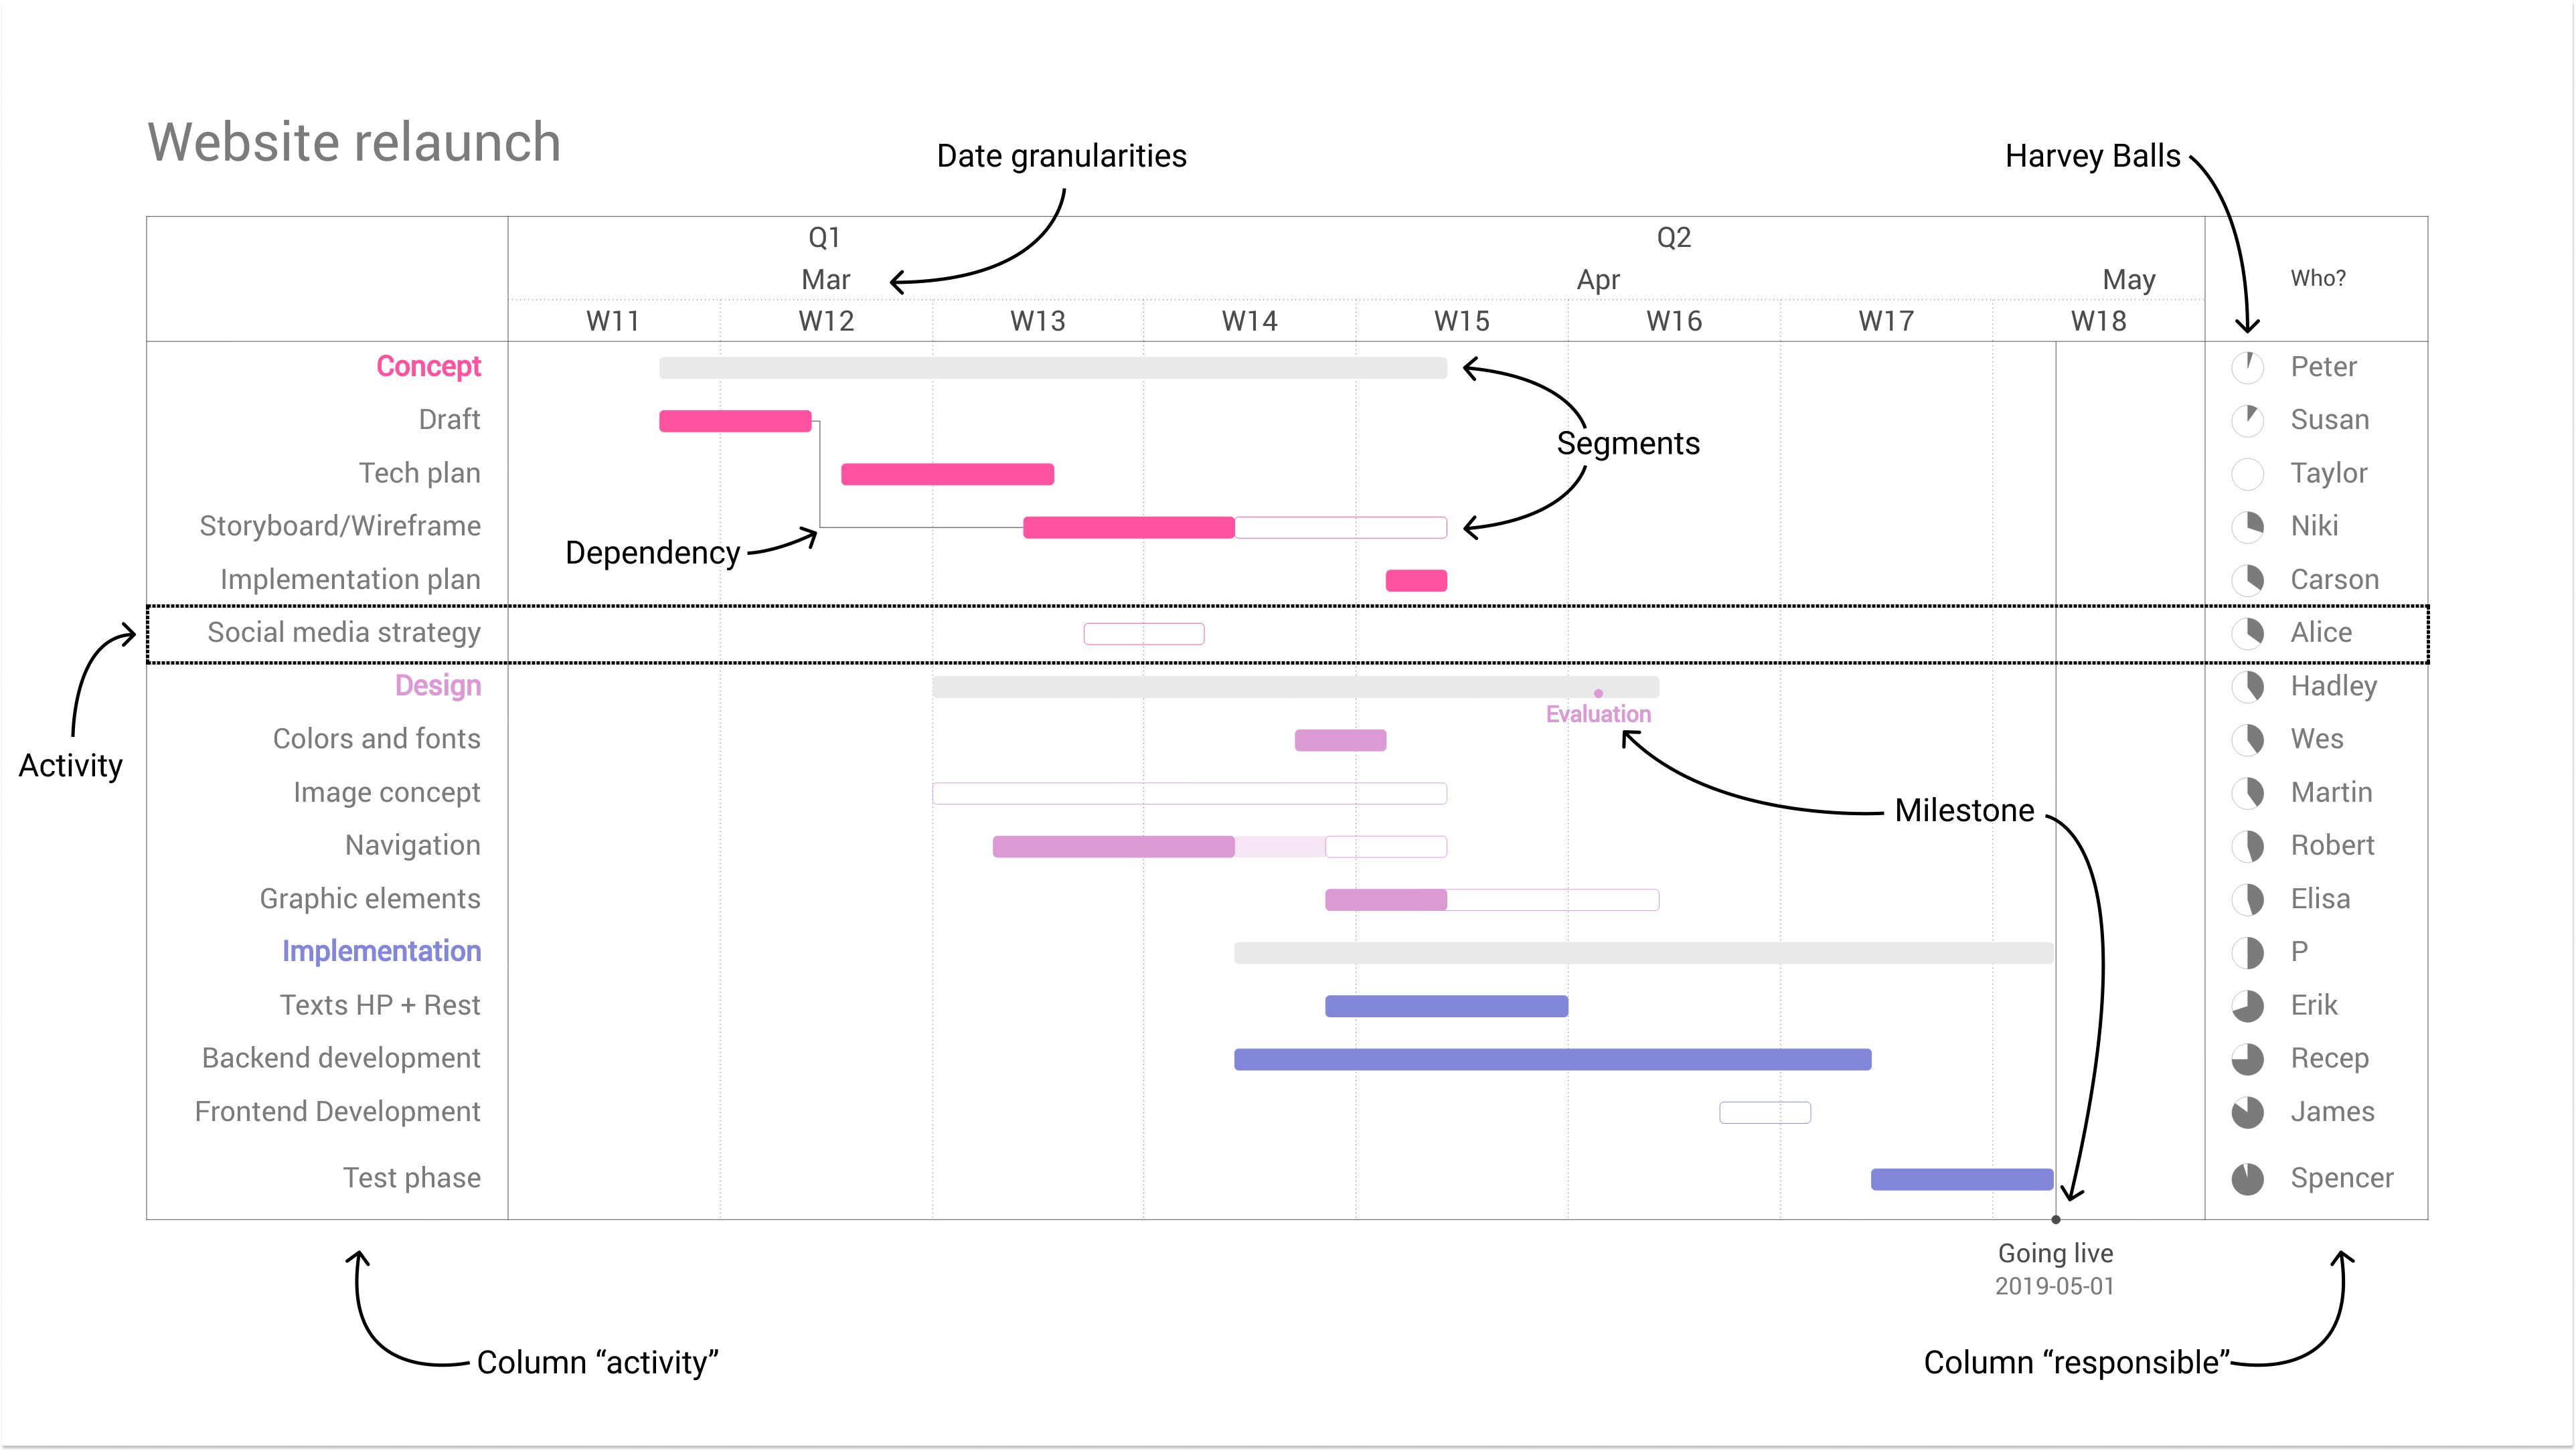
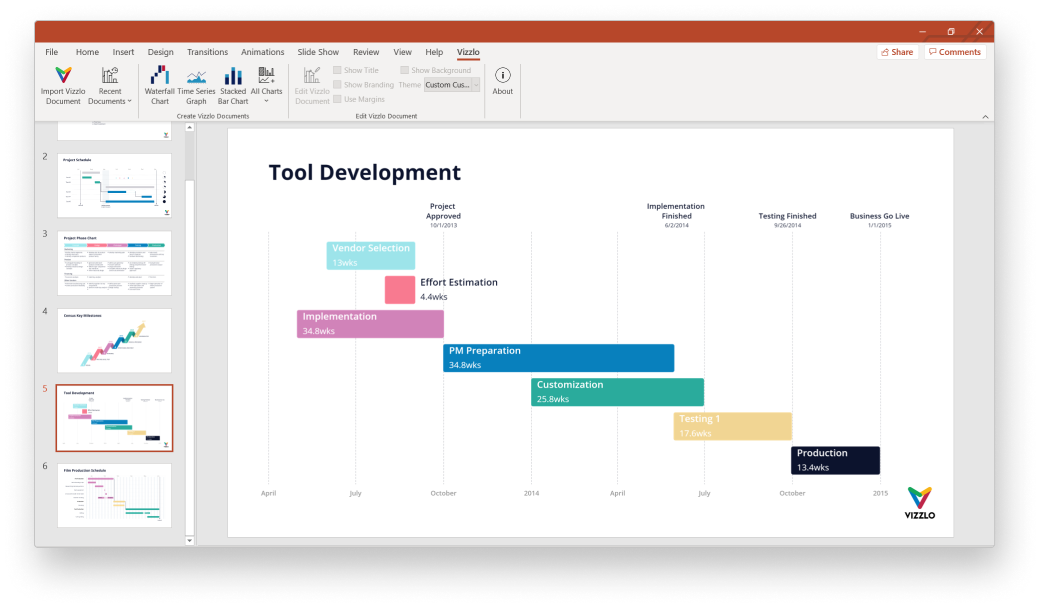
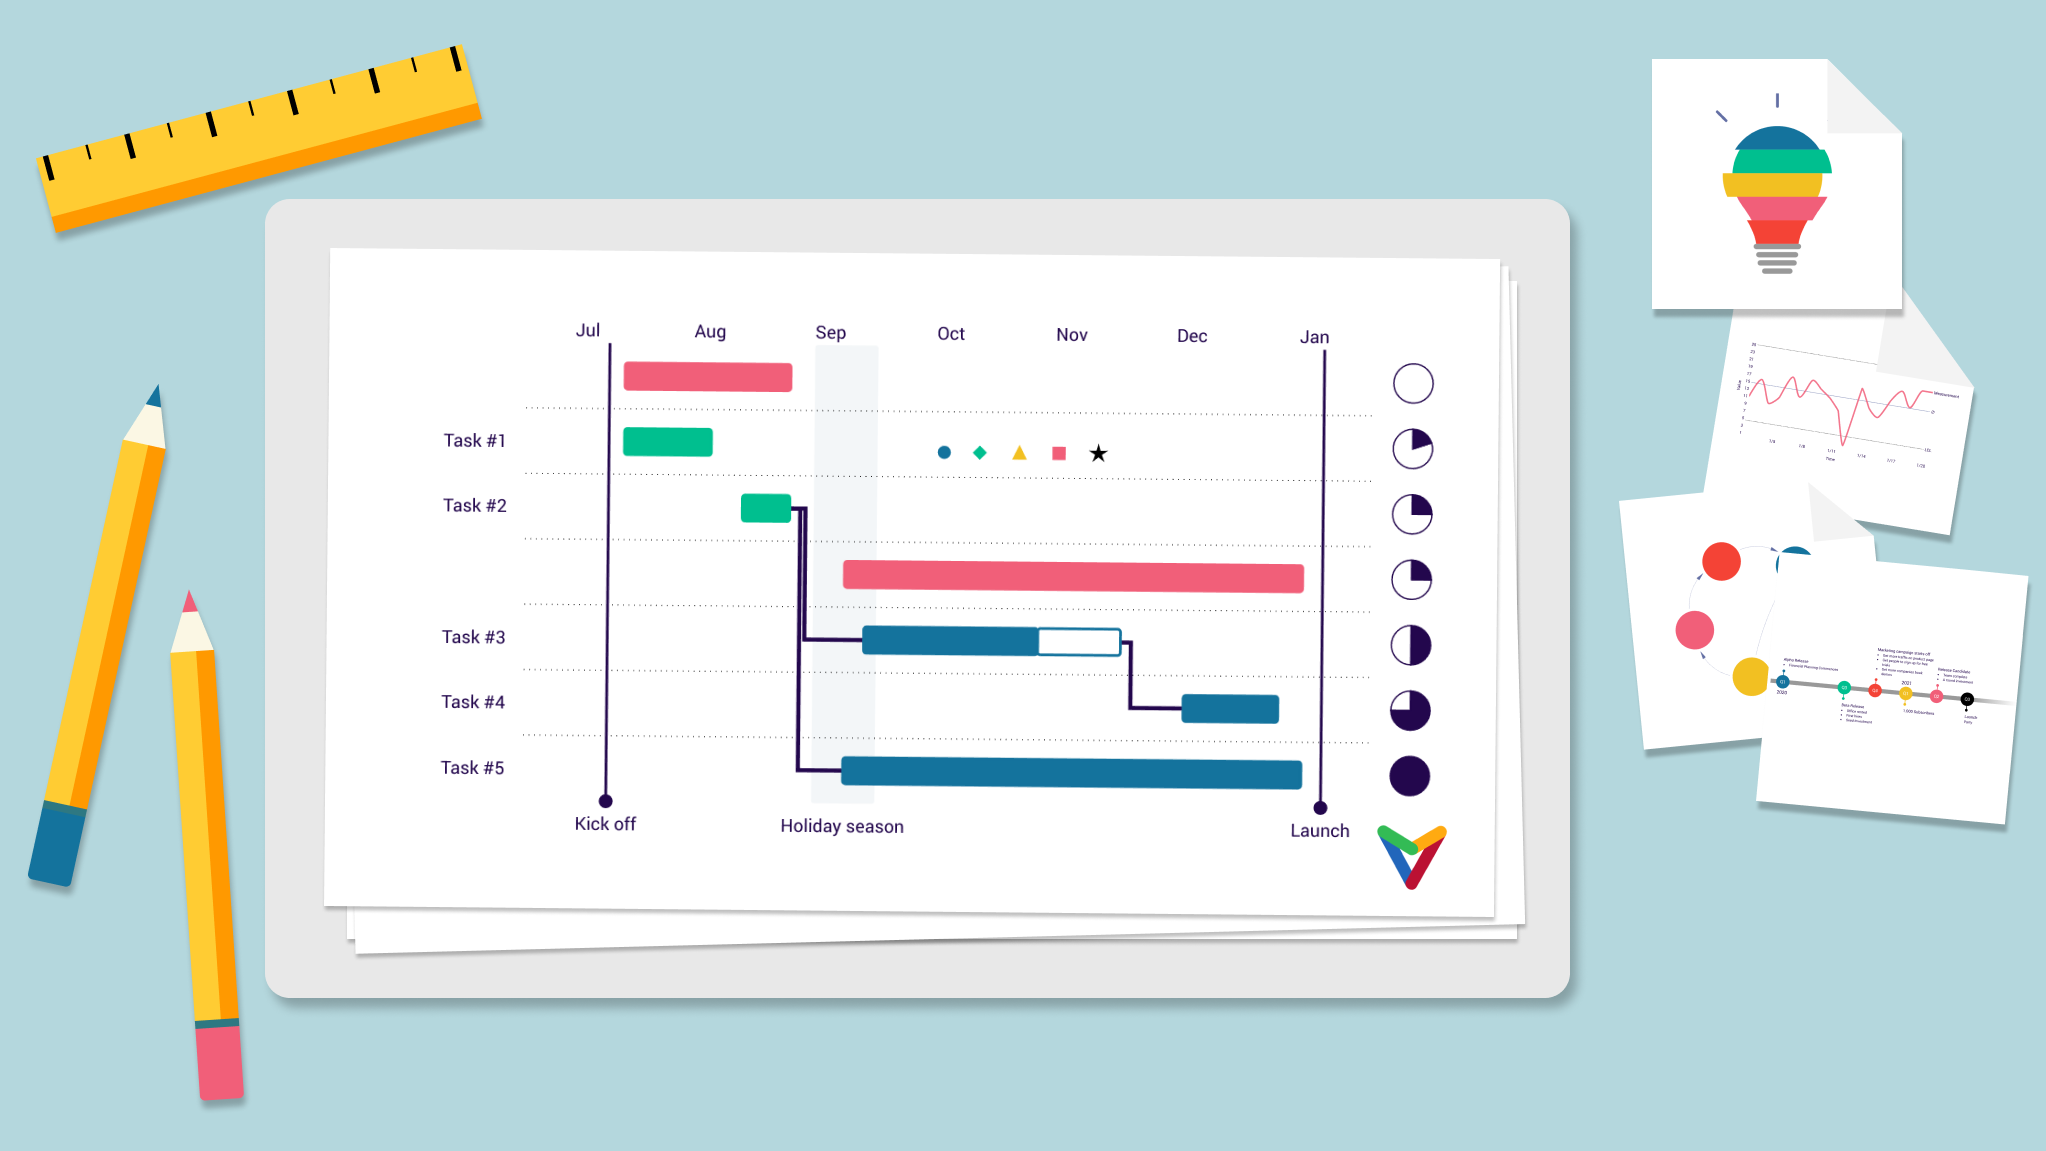
Gantt Charts


Pie Charts


Project Management
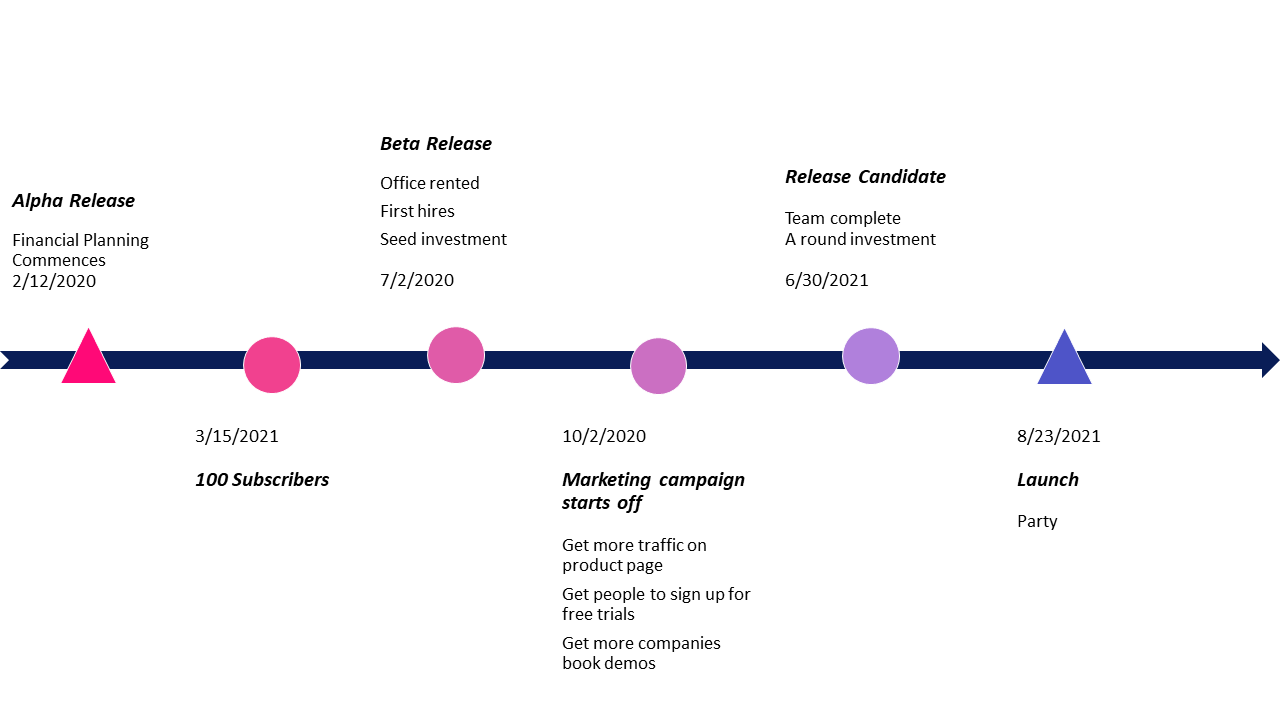
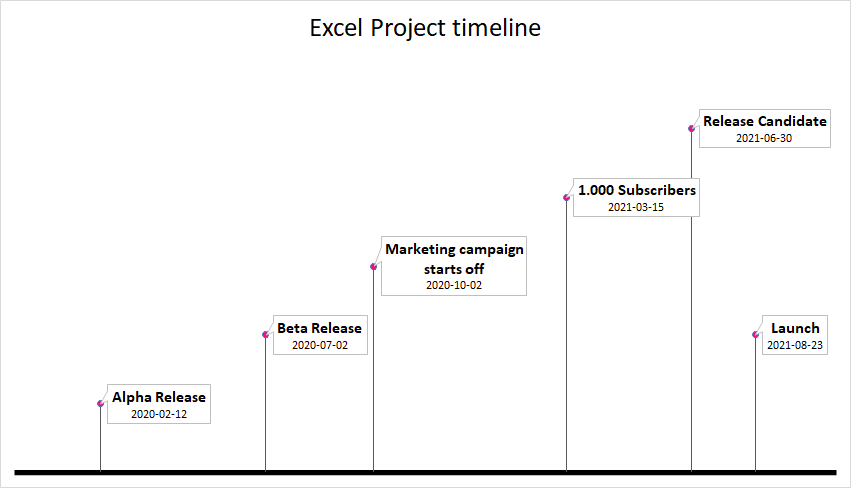
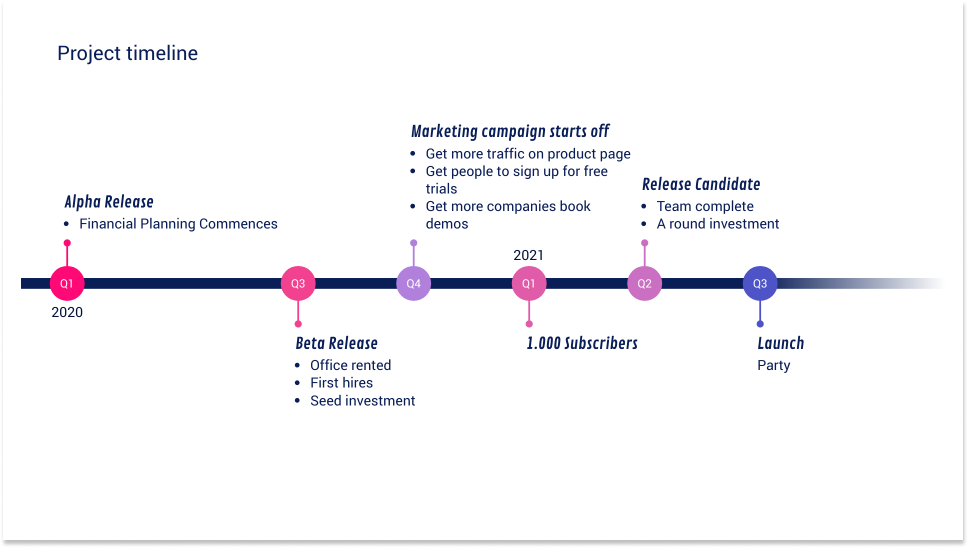
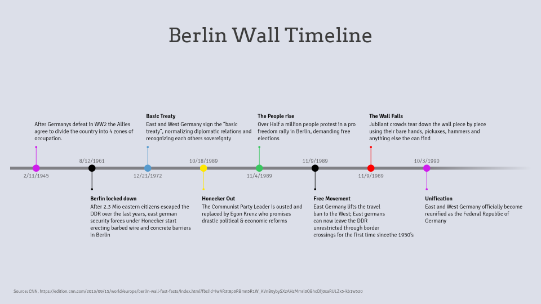
Timelines

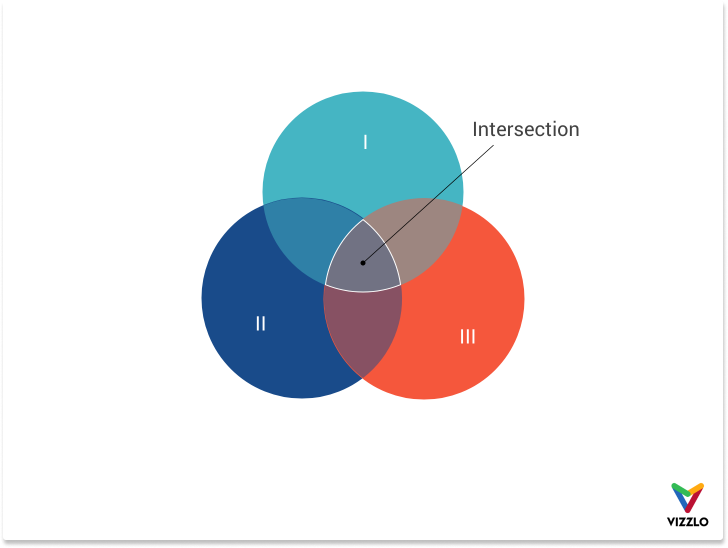
Venn Diagram


Create stunning visualizations in minutes!
Vizzlo graphics are super easy to create and customize. Discover a huge portfolio full of options to use in your next presentation!