Chart Vizzard
Vizzlos KI-basierter Diagramm-GeneratorThe Exit Polls
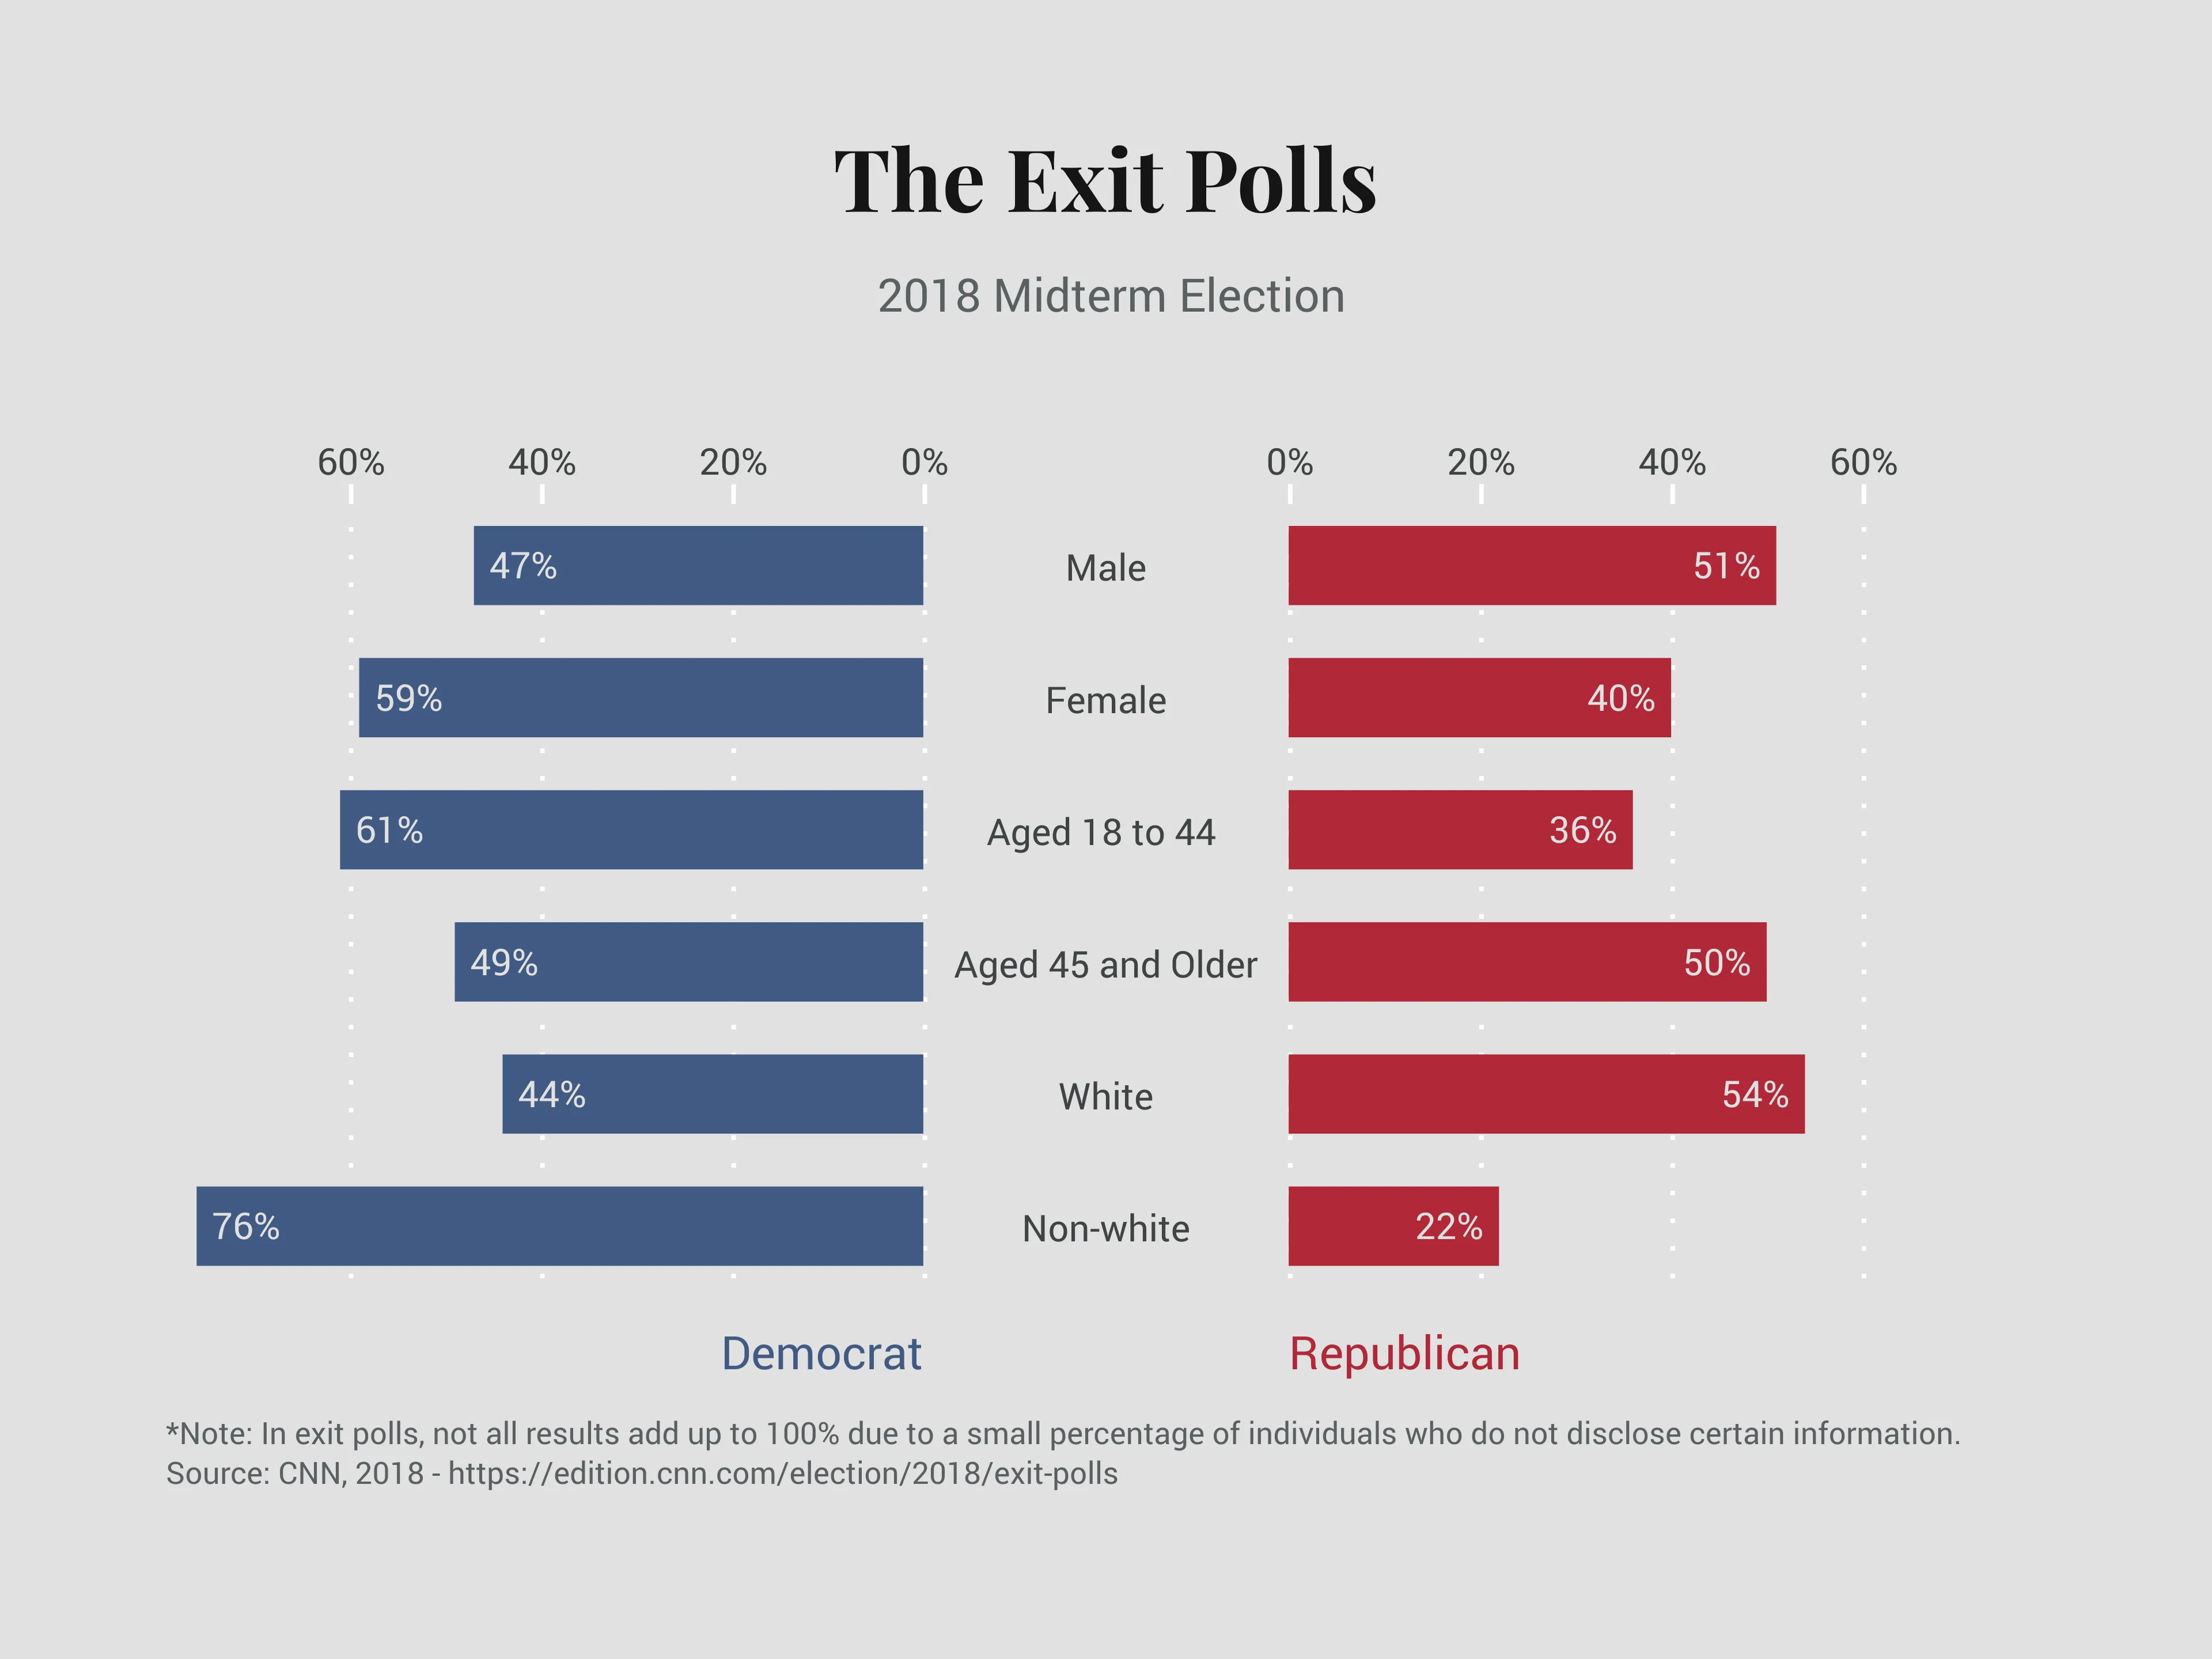
Exit polls survey a random sample of voters after their ballots have been cast and although their primary purpose is to provide TV networks and the AP with a sense of who might’ve won as soon as possible, they are not always right, so they tend to be tricky. Their importance remains since they also offer insight as to why a candidate might’ve won, by telling the tale of who went to the polls. Networks conduct their interviews differently, either talking to early voters on-premise, absentee voters on the phone, through opt-in online surveys, etc. This year’s exit polls were conducted a little differently, and you can click here if you want to learn about what changed.
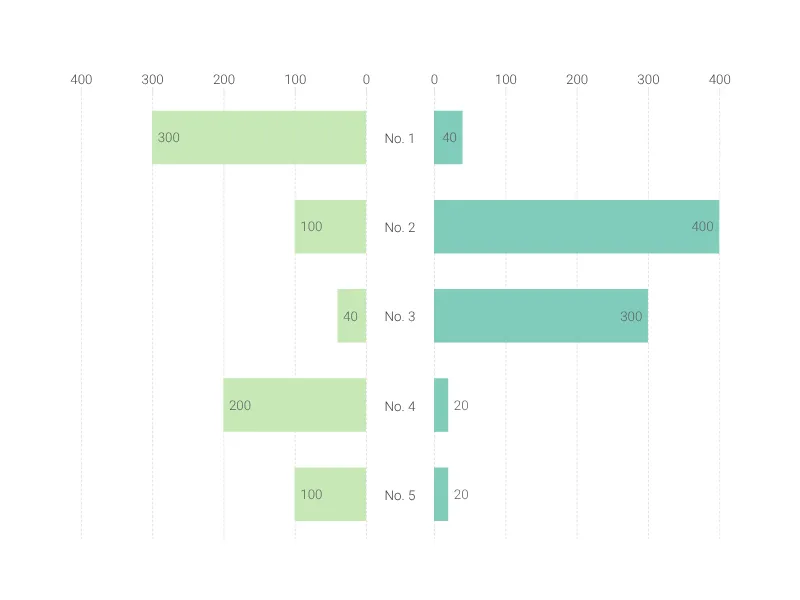
Dies ist ein Beispiel für Vizzlos "Schmetterlingsdiagramm"
Erstellen Sie ein Schmetterlingsdiagramm, um zwei Datensätze nebeneinander zu vergleichen.