Google Cloud’s business doubled in Q3 2026
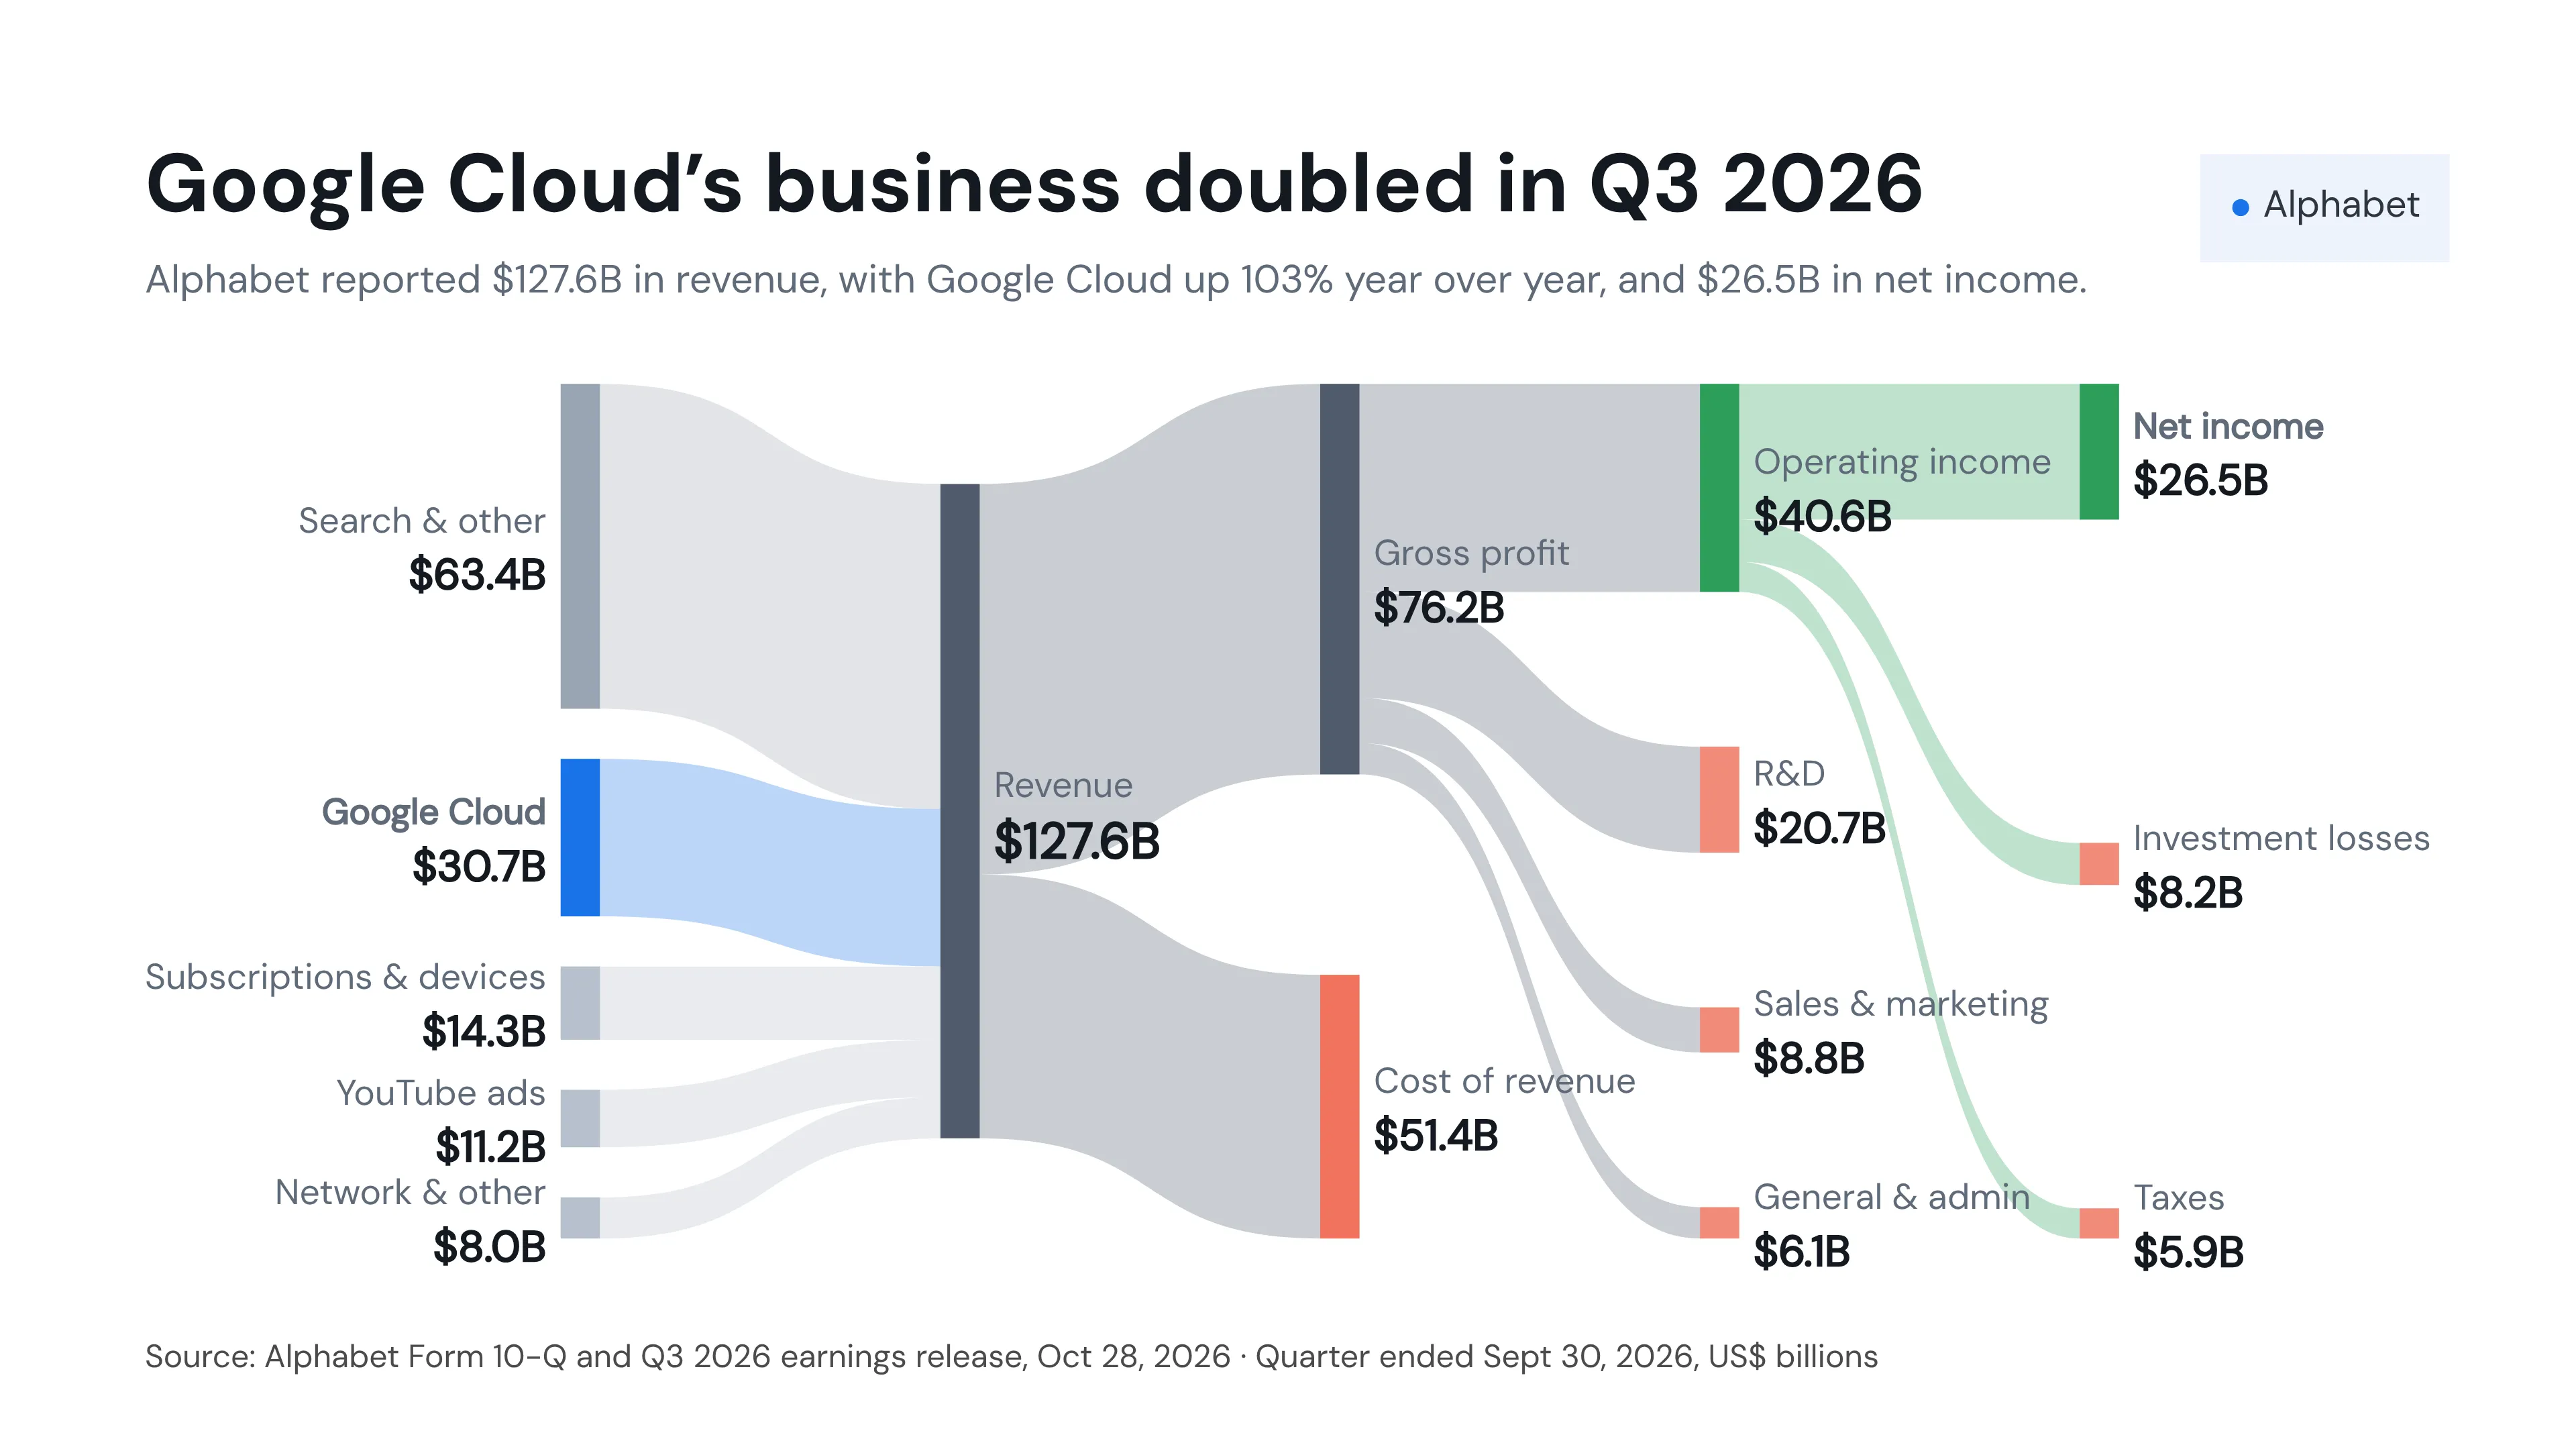
Google Cloud’s business doubled in Q3 2026 is a Sankey diagram that visualizes how Alphabet, the parent company of Google, turned $127.6 billion in revenue into profit in the third quarter of 2026. The chart traces each revenue stream — Google Search, Google Cloud, YouTube advertising, subscriptions and devices, and the Google Network — through costs and expenses to operating income and net income.
The visualization highlights the rapid rise of Google Cloud, whose revenue more than doubled year over year to $30.7 billion, driven by demand for AI infrastructure and Google’s TPU chips. Cloud now accounts for almost a quarter of Alphabet’s revenue, while Search remains the largest single source at $63.4 billion. Alphabet earned $40.6 billion in operating income, but net income fell to $26.5 billion after an $8.2 billion loss on investments, mainly an unrealized loss on its stake in SpaceX.
By showing every revenue source and cost category as proportional flows, the Sankey diagram makes it easy to see where the money comes from, where it goes and how much is left as profit. Sankey diagrams are particularly useful for visualizing income statements, budgets, energy flows, customer journeys and other data where quantities split and merge across several stages. Data comes from Alphabet’s Form 10-Q and Q3 2026 earnings release, published October 28, 2026.
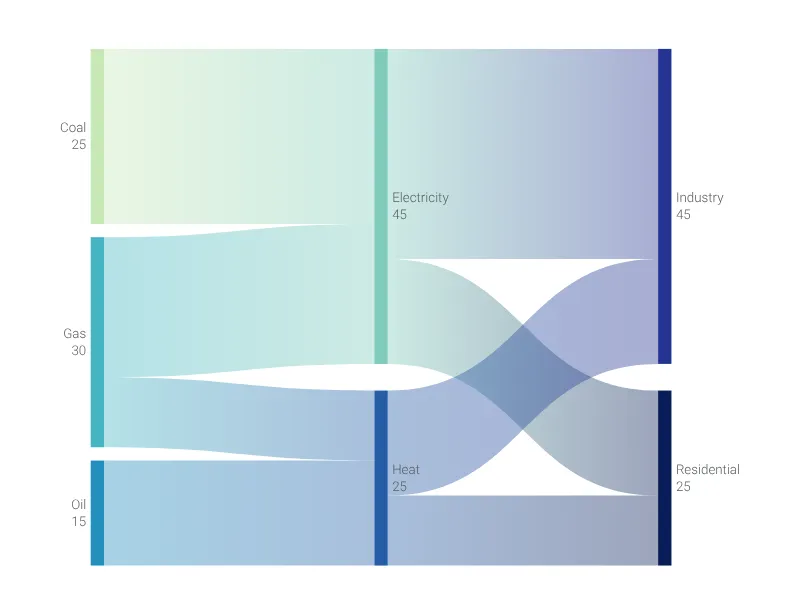
Dies ist ein Beispiel für Vizzlos "Sankey-Diagramm"
Visualisieren Sie Flüsse und Mengen zwischen Knoten mit proportional breiten Bändern. Ideal für Energieflüsse, Budgetverteilungen und Prozessanalysen.