Chart Vizzard
Vizzlos KI-basierter Diagramm-GeneratorWhich Milk Type is Worst for the Environment?
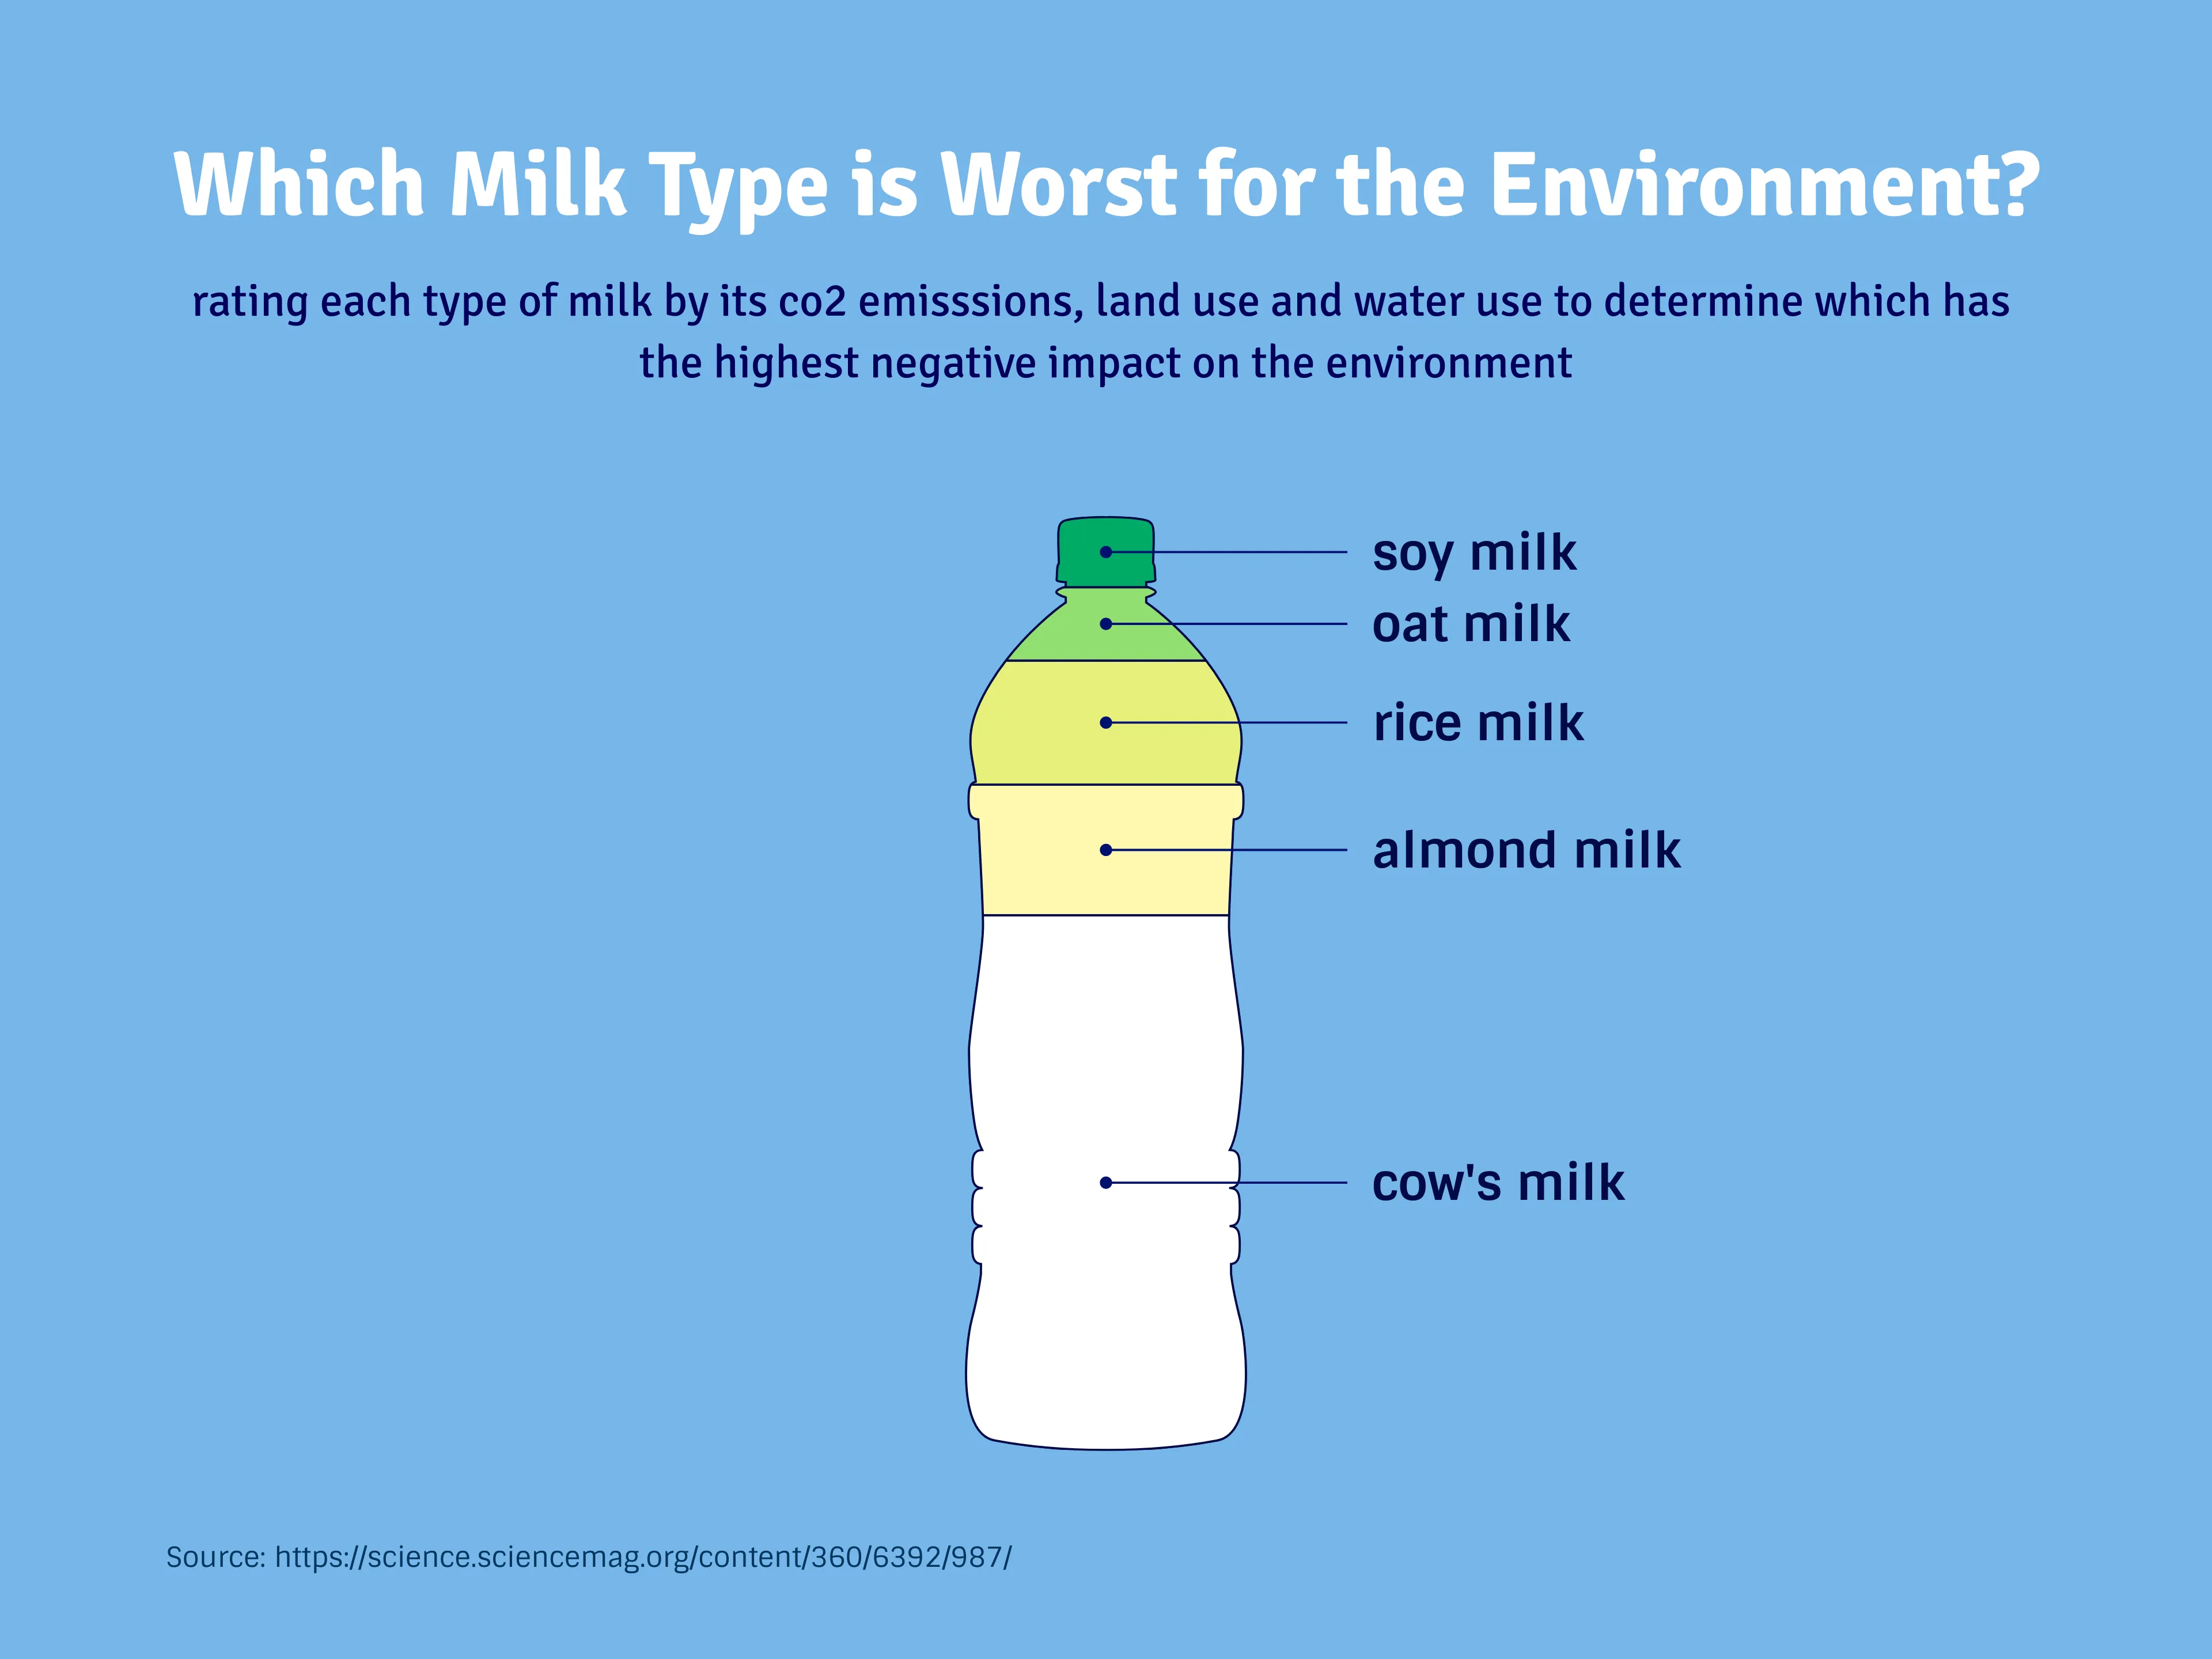
We are all trying to make better choices for the environment, but the trend for ‘health-marketing’ makes it difficult to ascertain exactly what the right choices are. This stacked pictogram bottle chart gives you solid data from a 2018 Oxford University study comparing the CO2 emissions, land use and water use of each milk/milk substitute type to determine which uses the most resources. Unsurprisingly, cow’s milk uses more than double the resources of all other milk alternatives combined, and remains a bad choice for the eco-conscious. However, you might want to re-think exchanging it for almond milk - this bio store favourite gets a higher impact rating for its significant water consumption.
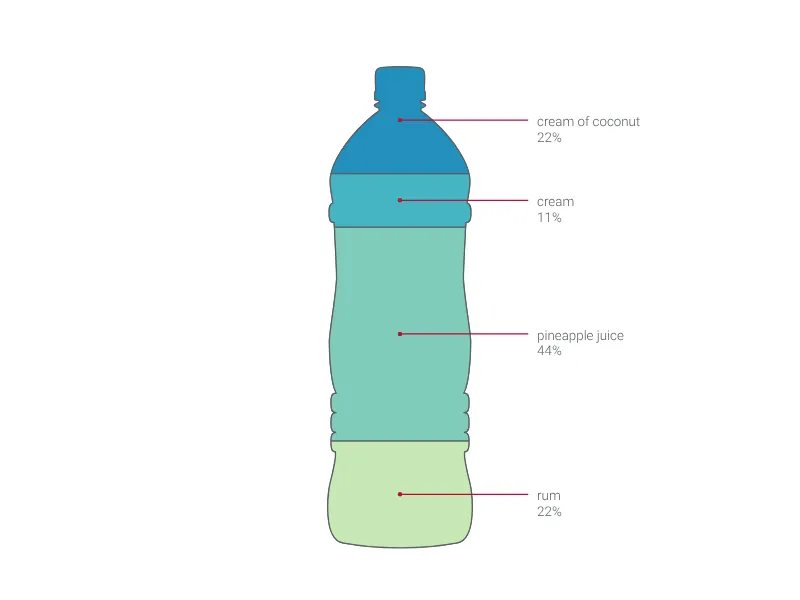
Dies ist ein Beispiel für Vizzlos "Flaschendiagramm"
Visualisieren Sie verschiedene Werte oder Füllstände mithilfe einer Auswahl an Wasser-, Bier- oder Weinflaschen.