VORSCHAU
Chart Vizzard
Vizzlos KI-basierter Diagramm-GeneratorStar Wars - the force accounted
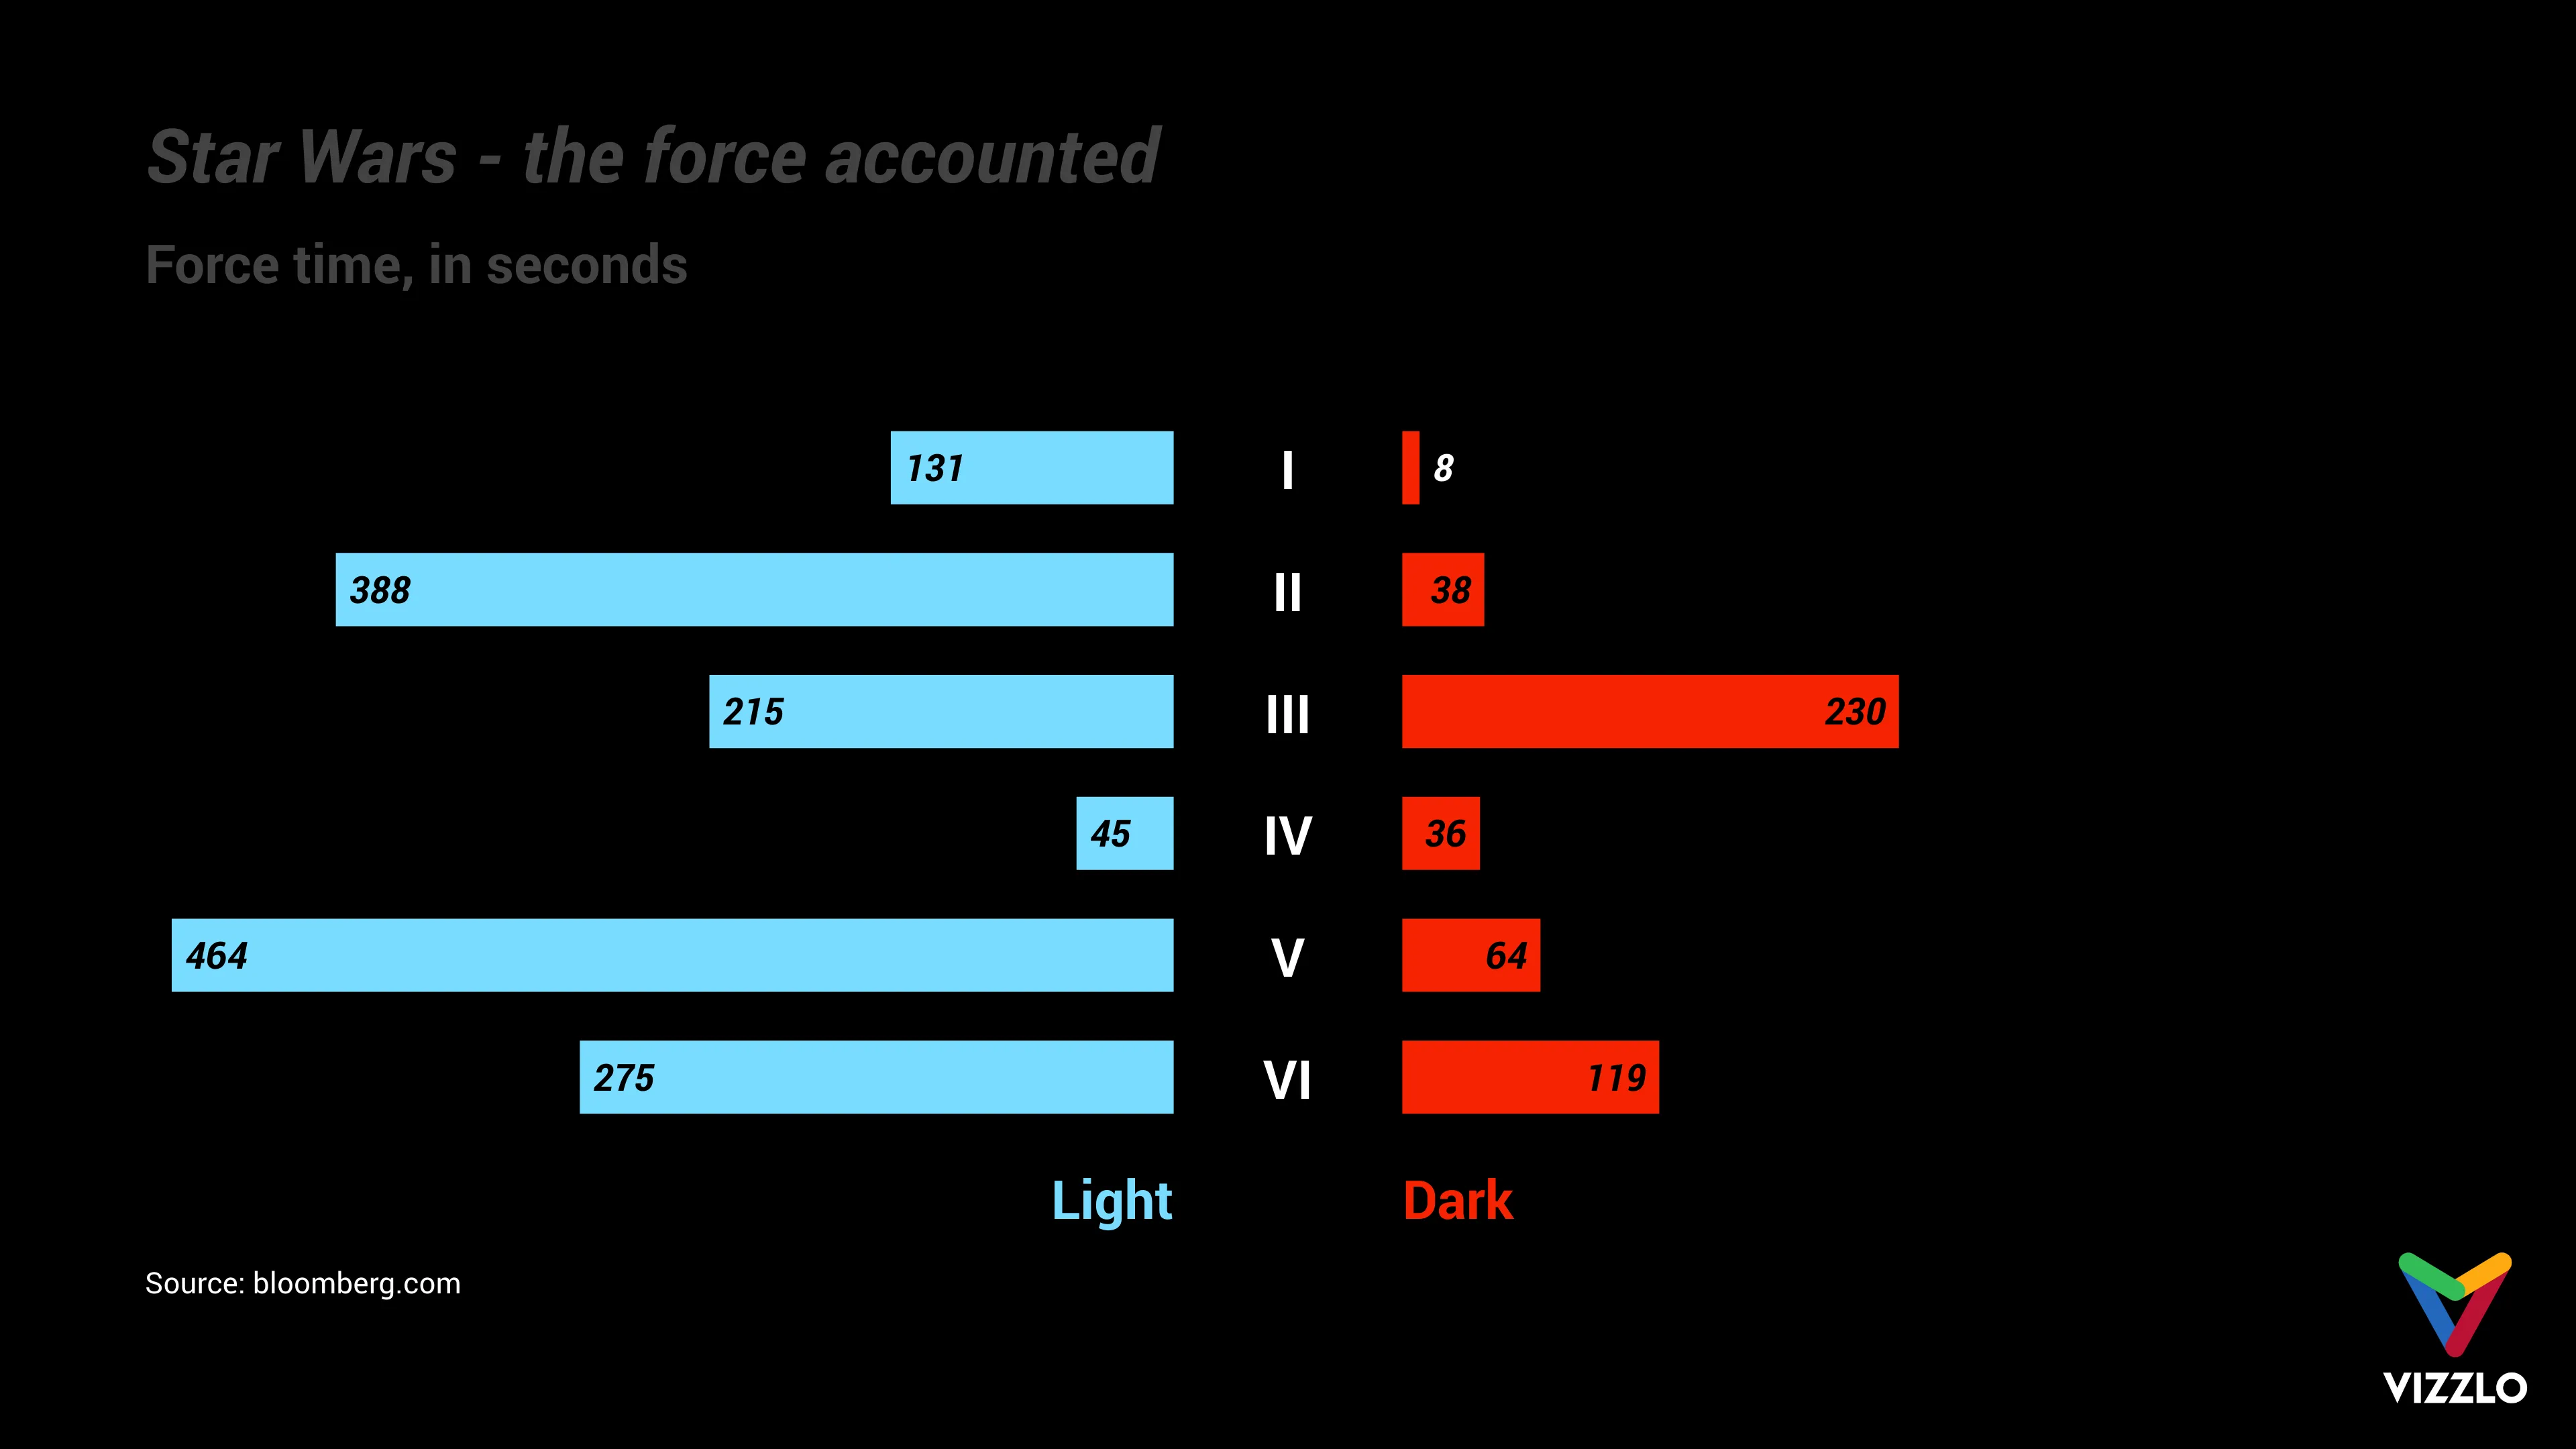
Star Wars Day, May 4th. This gallery post recreates a plot from this Bloomberg article: https://www.bloomberg.com/graphics/2015-star-wars-the-force-accounted/
The diagram shows the time, in seconds, that can be allocated to each side for the Force screen: light side vs. dark side.
The authors pointed out that only 4 percent of the 805-minute Star Wars film canon involves discernible Force use.
May the 4th be with you!
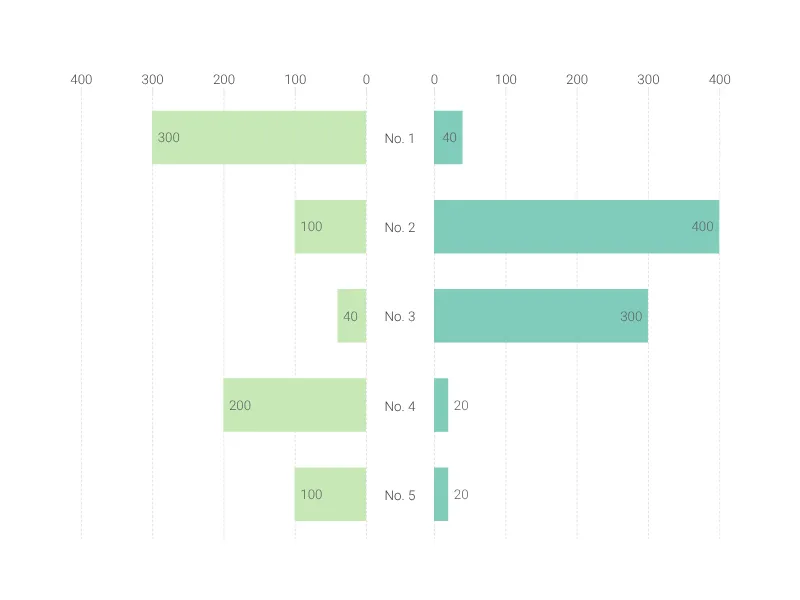
Dies ist ein Beispiel für Vizzlos "Schmetterlingsdiagramm"
Erstellen Sie ein Schmetterlingsdiagramm, um zwei Datensätze nebeneinander zu vergleichen.