VORSCHAU
Chart Vizzard
Vizzlos KI-basierter Diagramm-GeneratorThe Big Mac index
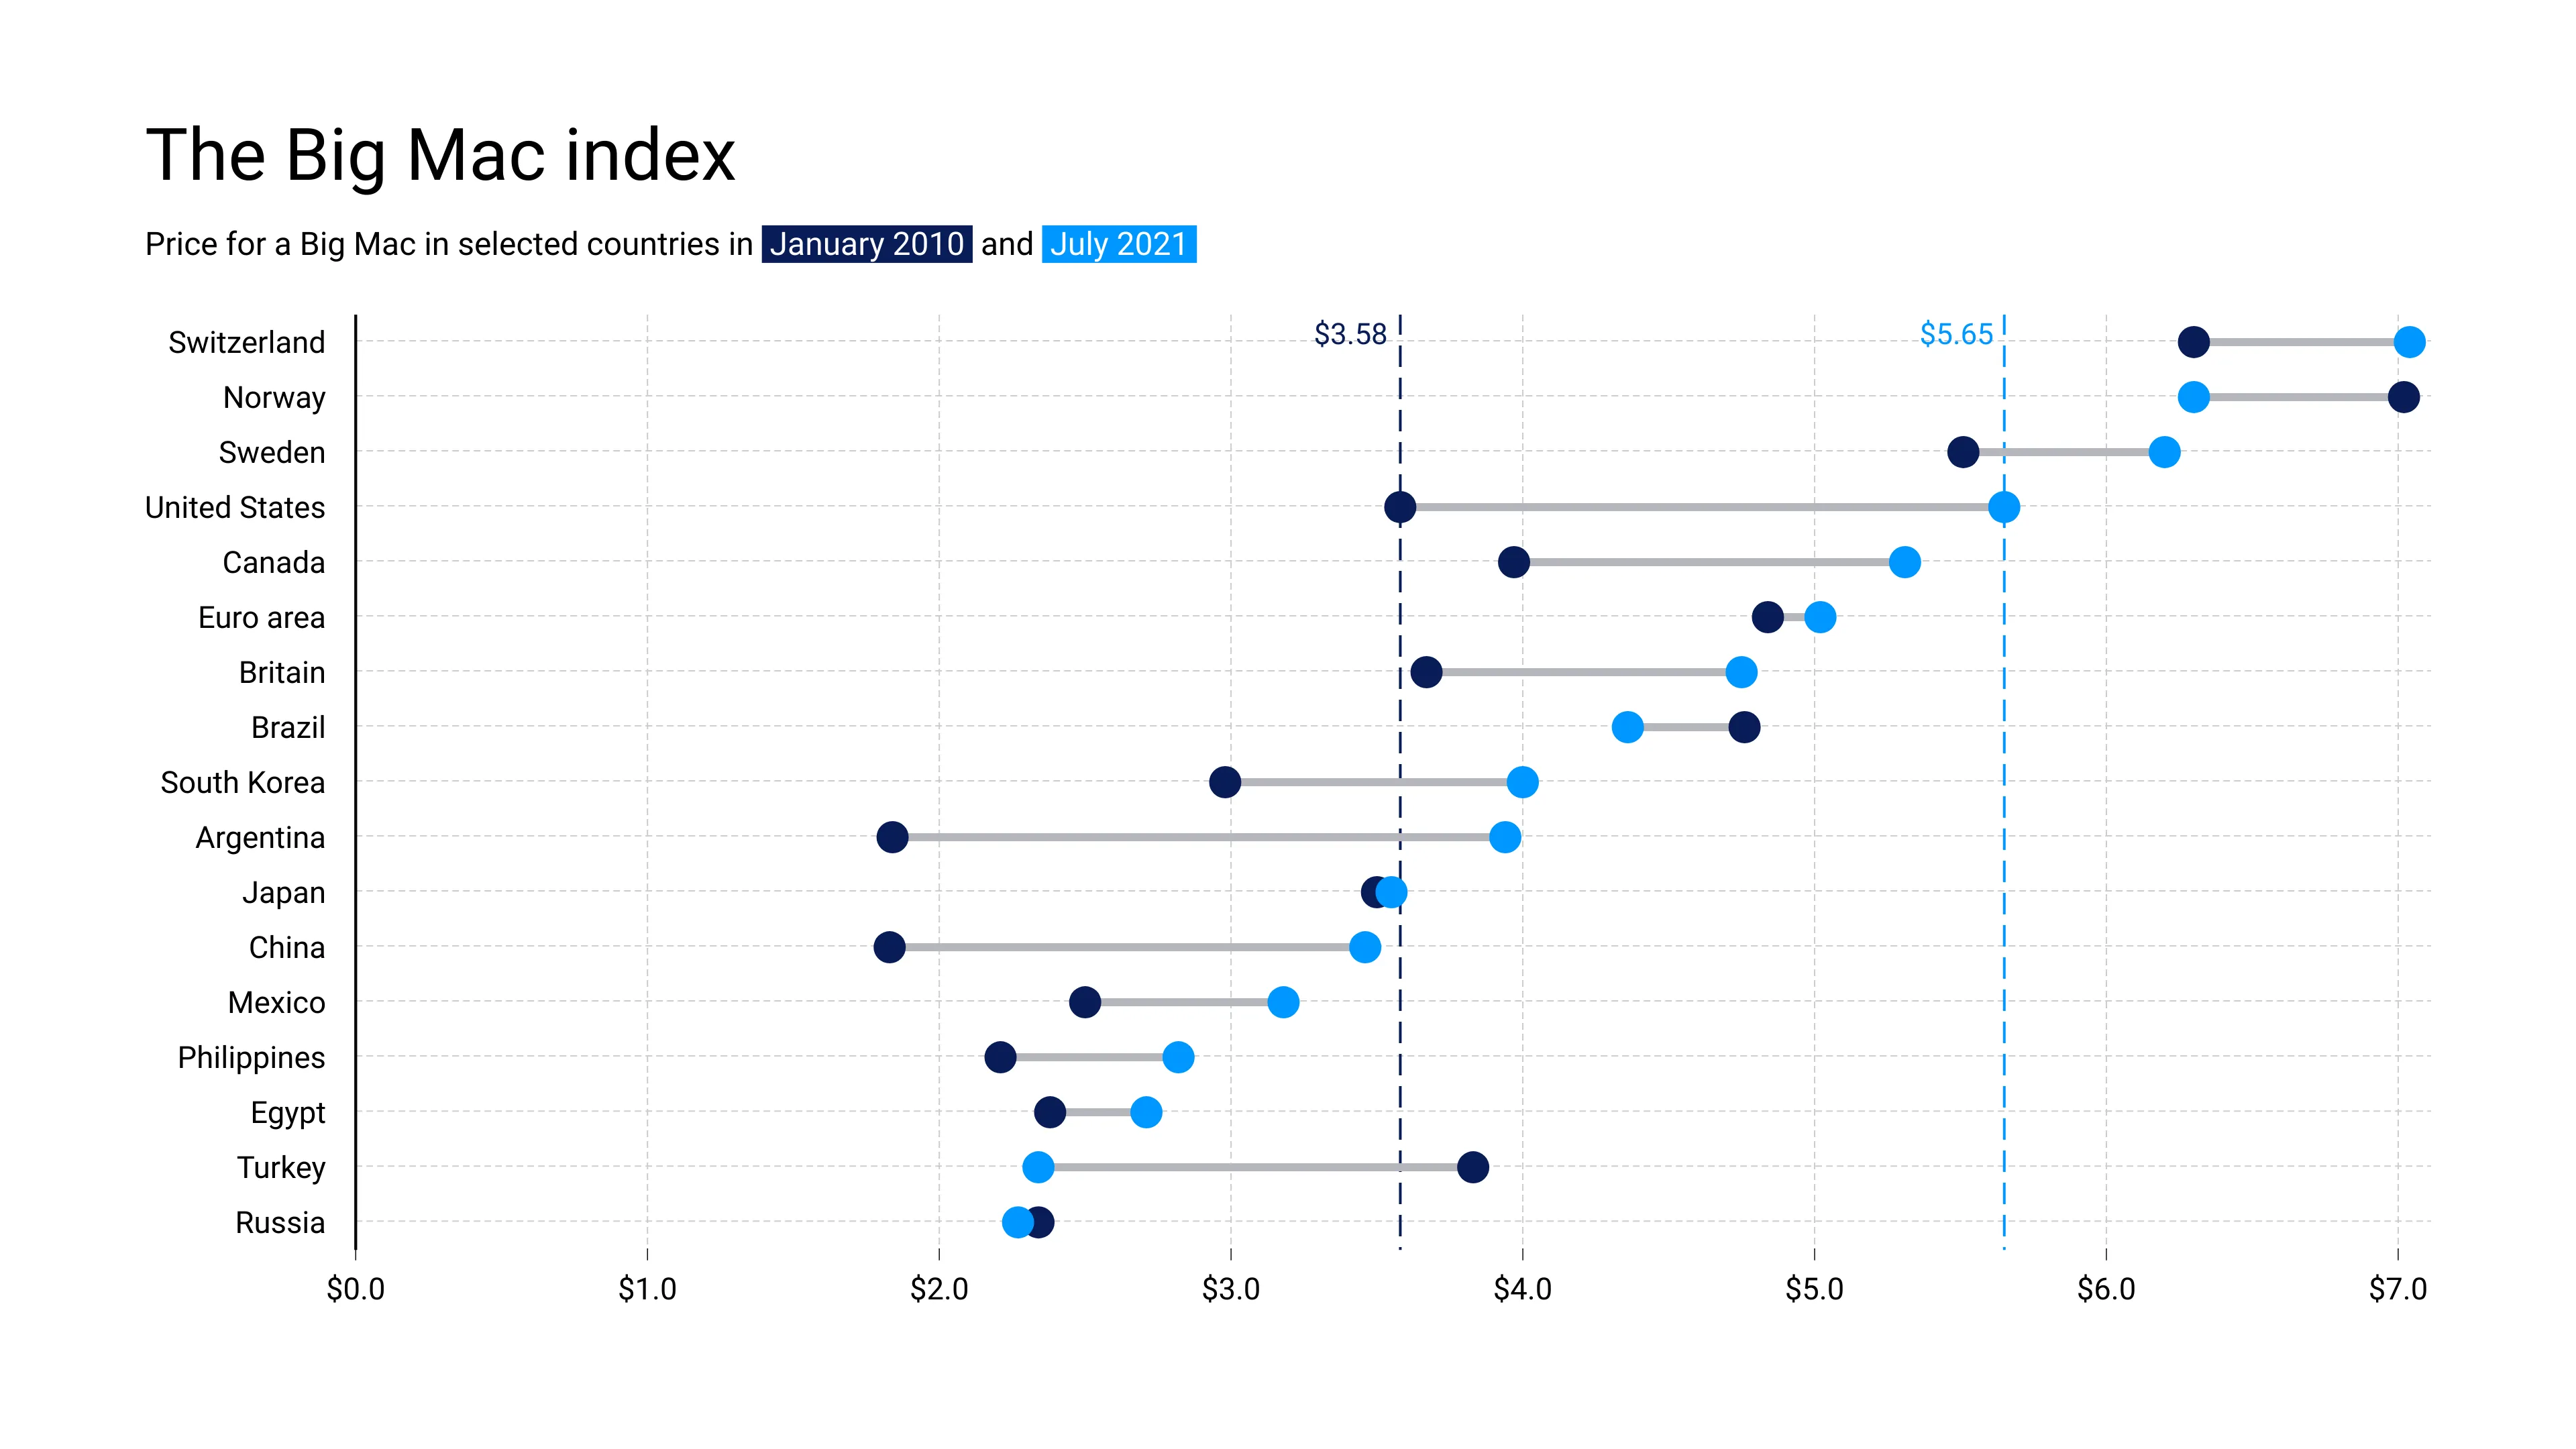
The Big Mac index was invented by The Economist in 1986 an informal way of measuring the purchasing power parity (PPP) between two currencies and provides a test if they are at their “correct” level. It “seeks to make exchange-rate theory a bit more digestible.”
For example, using figues in July 2021: the price of a Big Mac was $5.65 in the US and €4.27 in the Euro area. The implied purchasing power parity is $1.32 to €1, that is $5.65 / €4.27 = 1.32.
This compares with an actual exchange rate of $1.18 to €1 at the time, thus the euro was undervalued against the dollar by 11%.
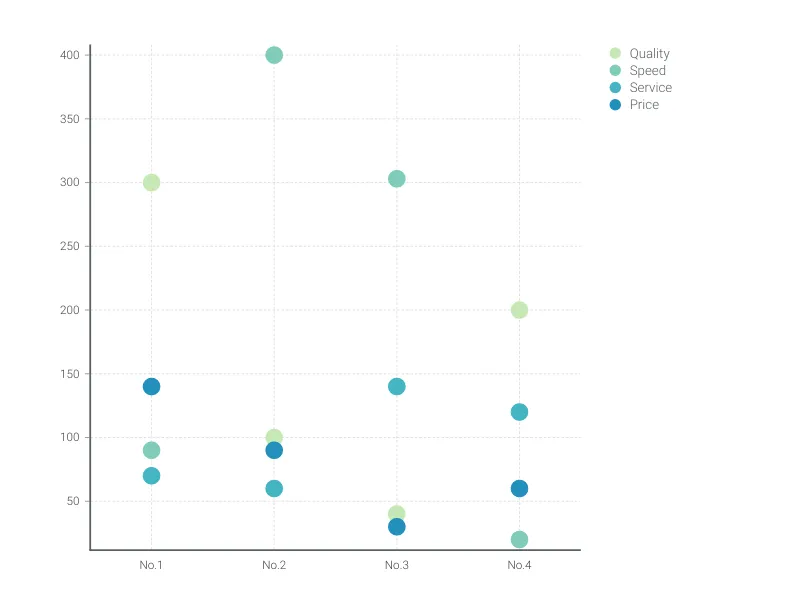
Dies ist ein Beispiel für Vizzlos "Punktdiagramm"
Das Punktdiagramm ist eine visuell ansprechende Alternative zum Balkendiagramm für einzelne oder mehrere Datenkategorien.