VORSCHAU
Chart Vizzard
Vizzlos KI-basierter Diagramm-GeneratorTour de France Average Speed
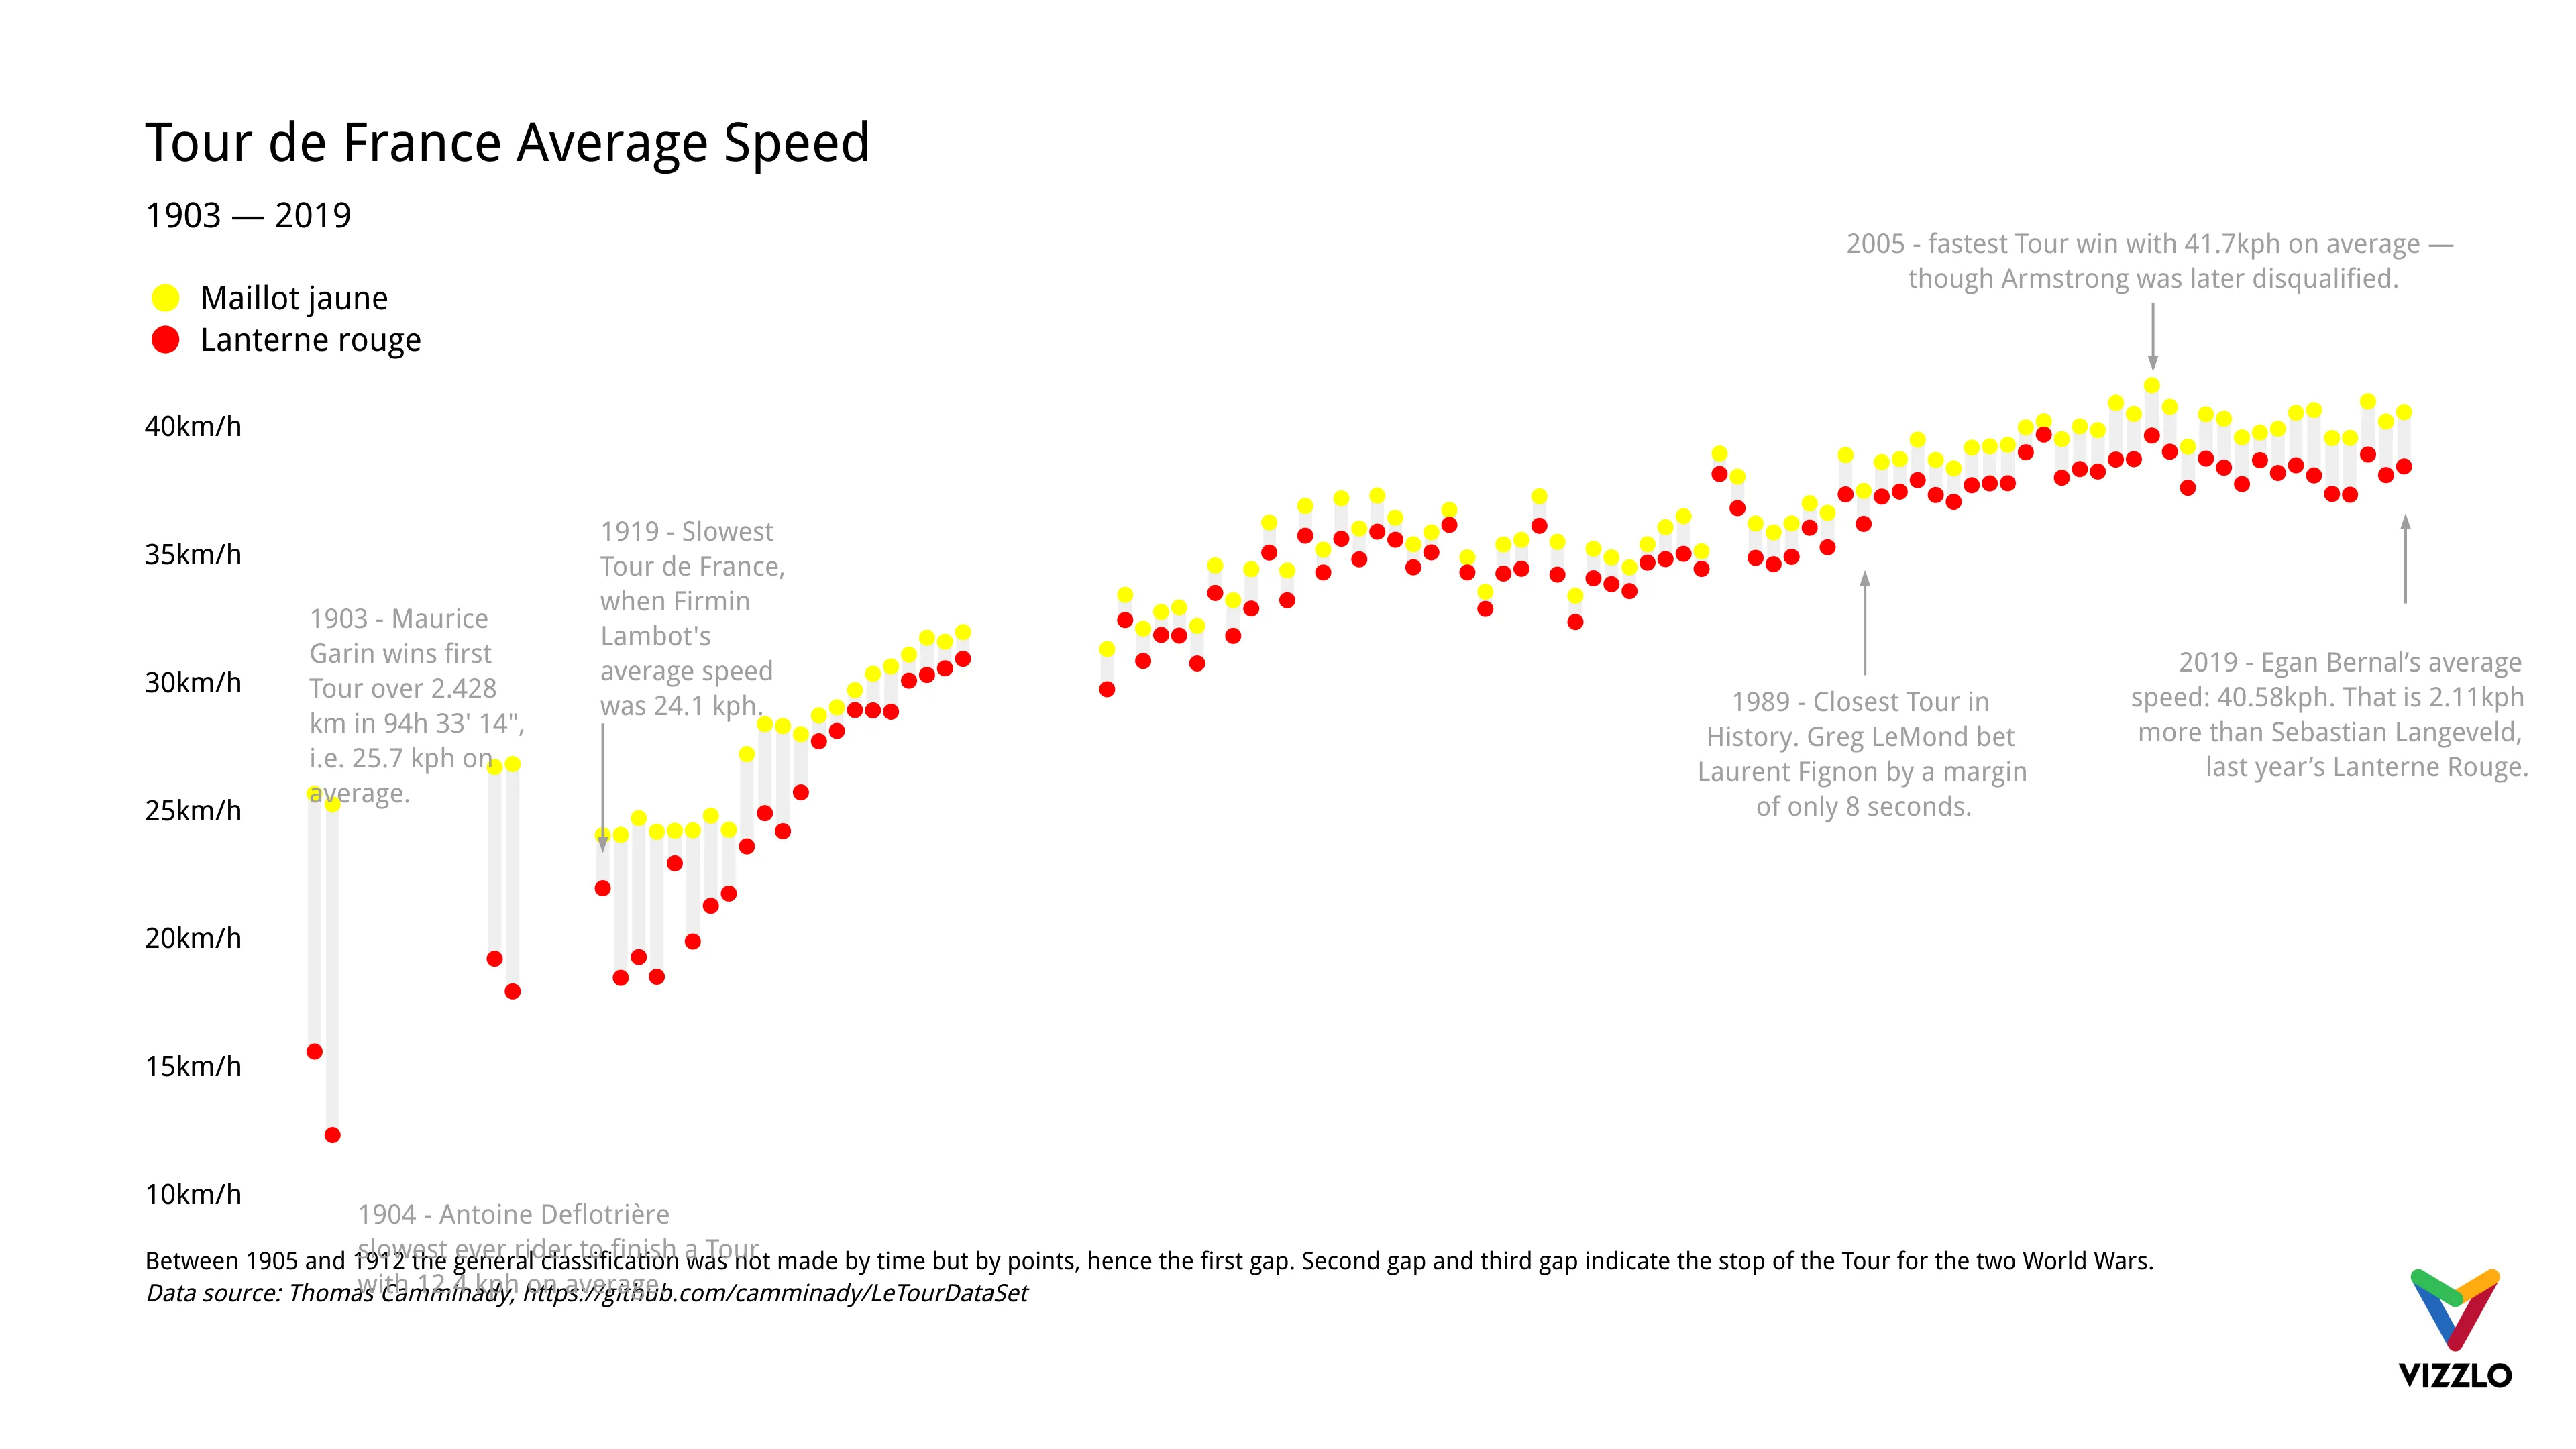
For a long time it was not clear whether the Tour de France 2020 would take place due to the Corona pandemic.
Last week it was then announced that the start of the world’s most important bicycle race would be postponed until August. Time for us to look back at the results so far. The chart shows the difference in average speed between the winner of the Tour and the rider who finished last.
To win the Tour, it takes about 40km/h on average (~25mph) for the more than 3,000 km distance. In 2017 Chris Froome drove the fastest average speed so far with 40.996 kmph.
Dies ist ein Beispiel für Vizzlos "Punktdiagramm"
Das Punktdiagramm ist eine visuell ansprechende Alternative zum Balkendiagramm für einzelne oder mehrere Datenkategorien.