VORSCHAU
Chart Vizzard
Vizzlos KI-basierter Diagramm-GeneratorVisualizing Auto Insurance Rate by State in 2020
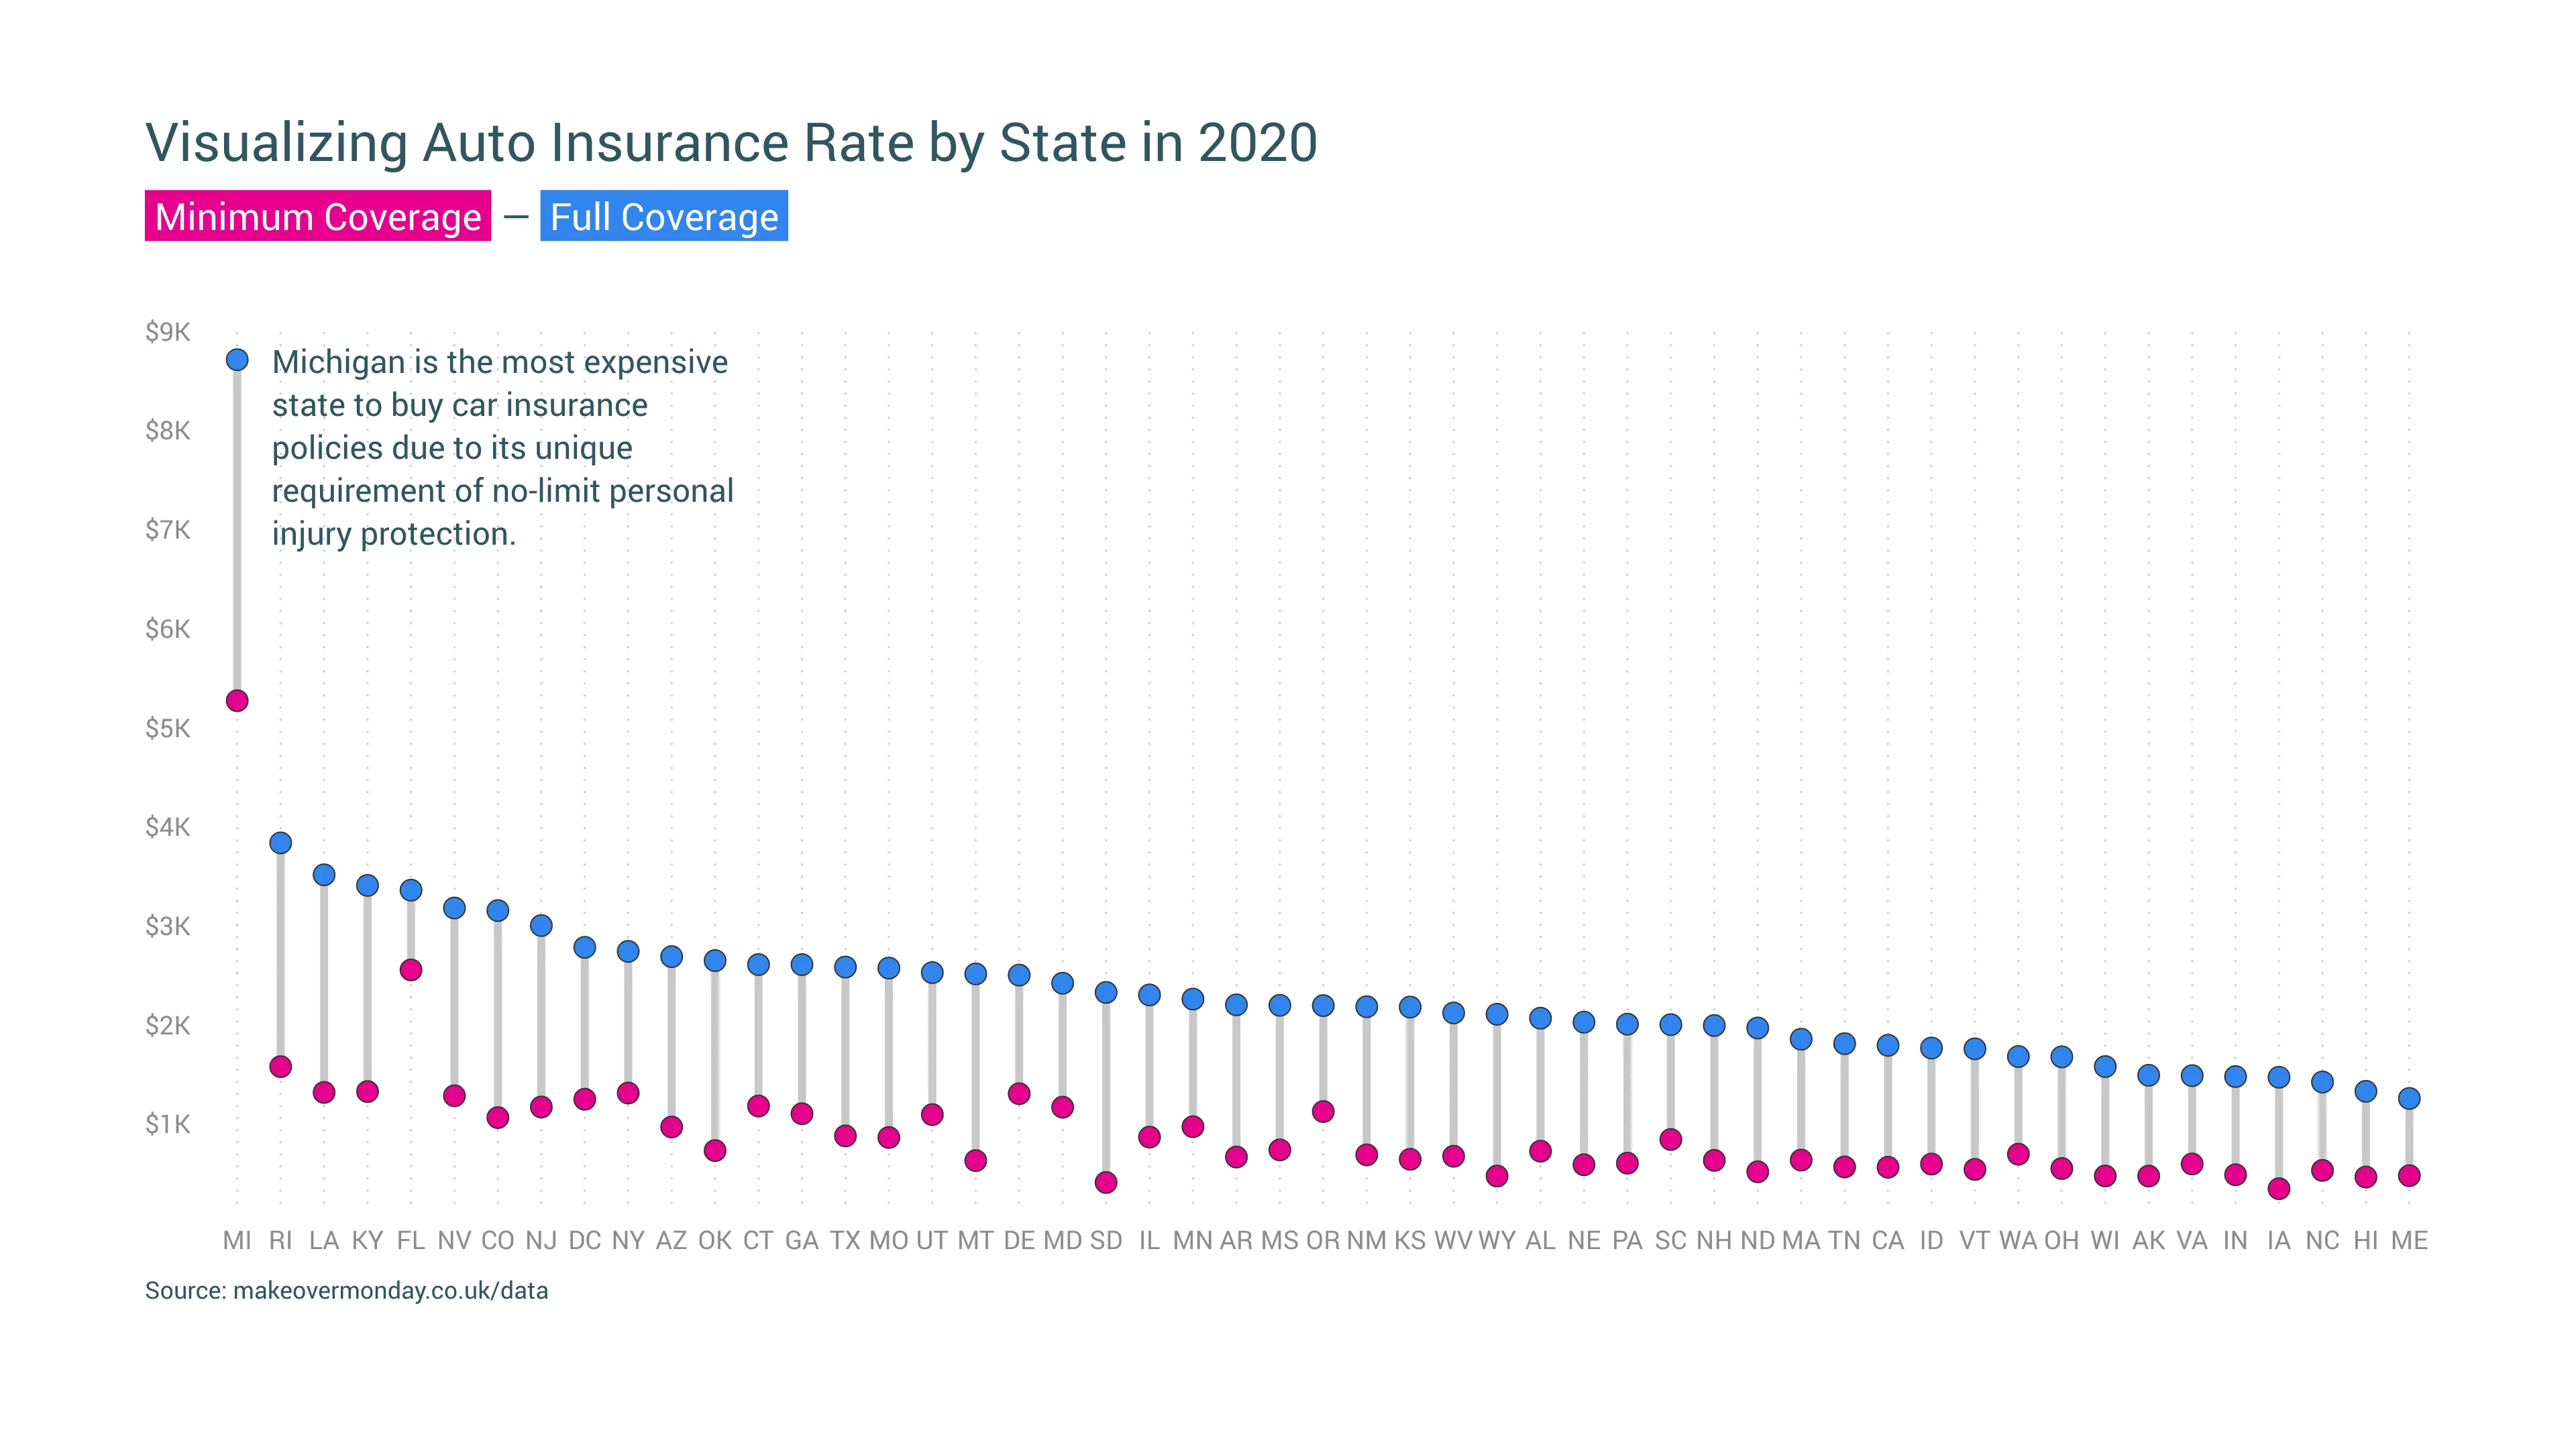
Michigan is the most expensive state where you can get car insurance. By far the most expensive state. Maine is at the other end of the spectrum.
In times of lockdown people drive less often, have fewer accidents and therefore insurance companies have higher profits. This means that you could make significant savings by switching to the cheapest policy available.
Data can be downloaded here: https://data.world/makeovermonday/2020w20
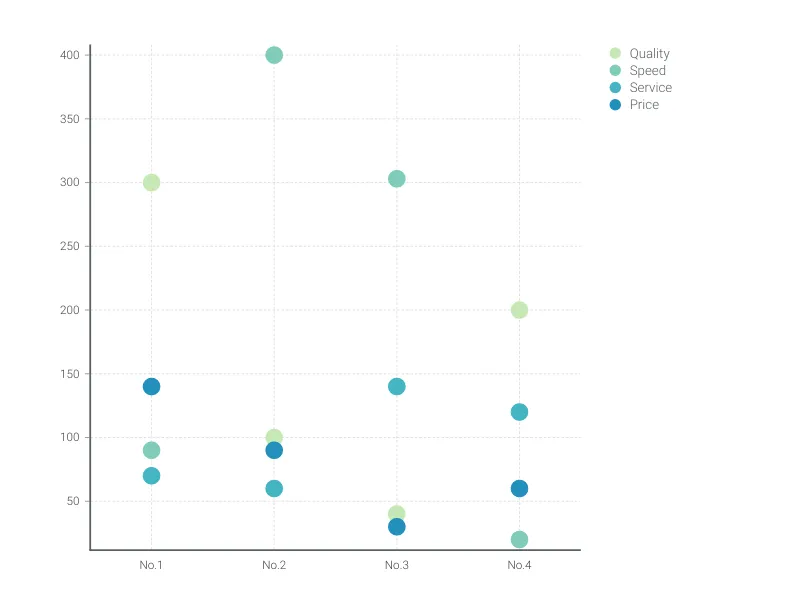
Dies ist ein Beispiel für Vizzlos "Punktdiagramm"
Das Punktdiagramm ist eine visuell ansprechende Alternative zum Balkendiagramm für einzelne oder mehrere Datenkategorien.