Chart Vizzard
Vizzlos KI-basierter Diagramm-GeneratorBored Britannia
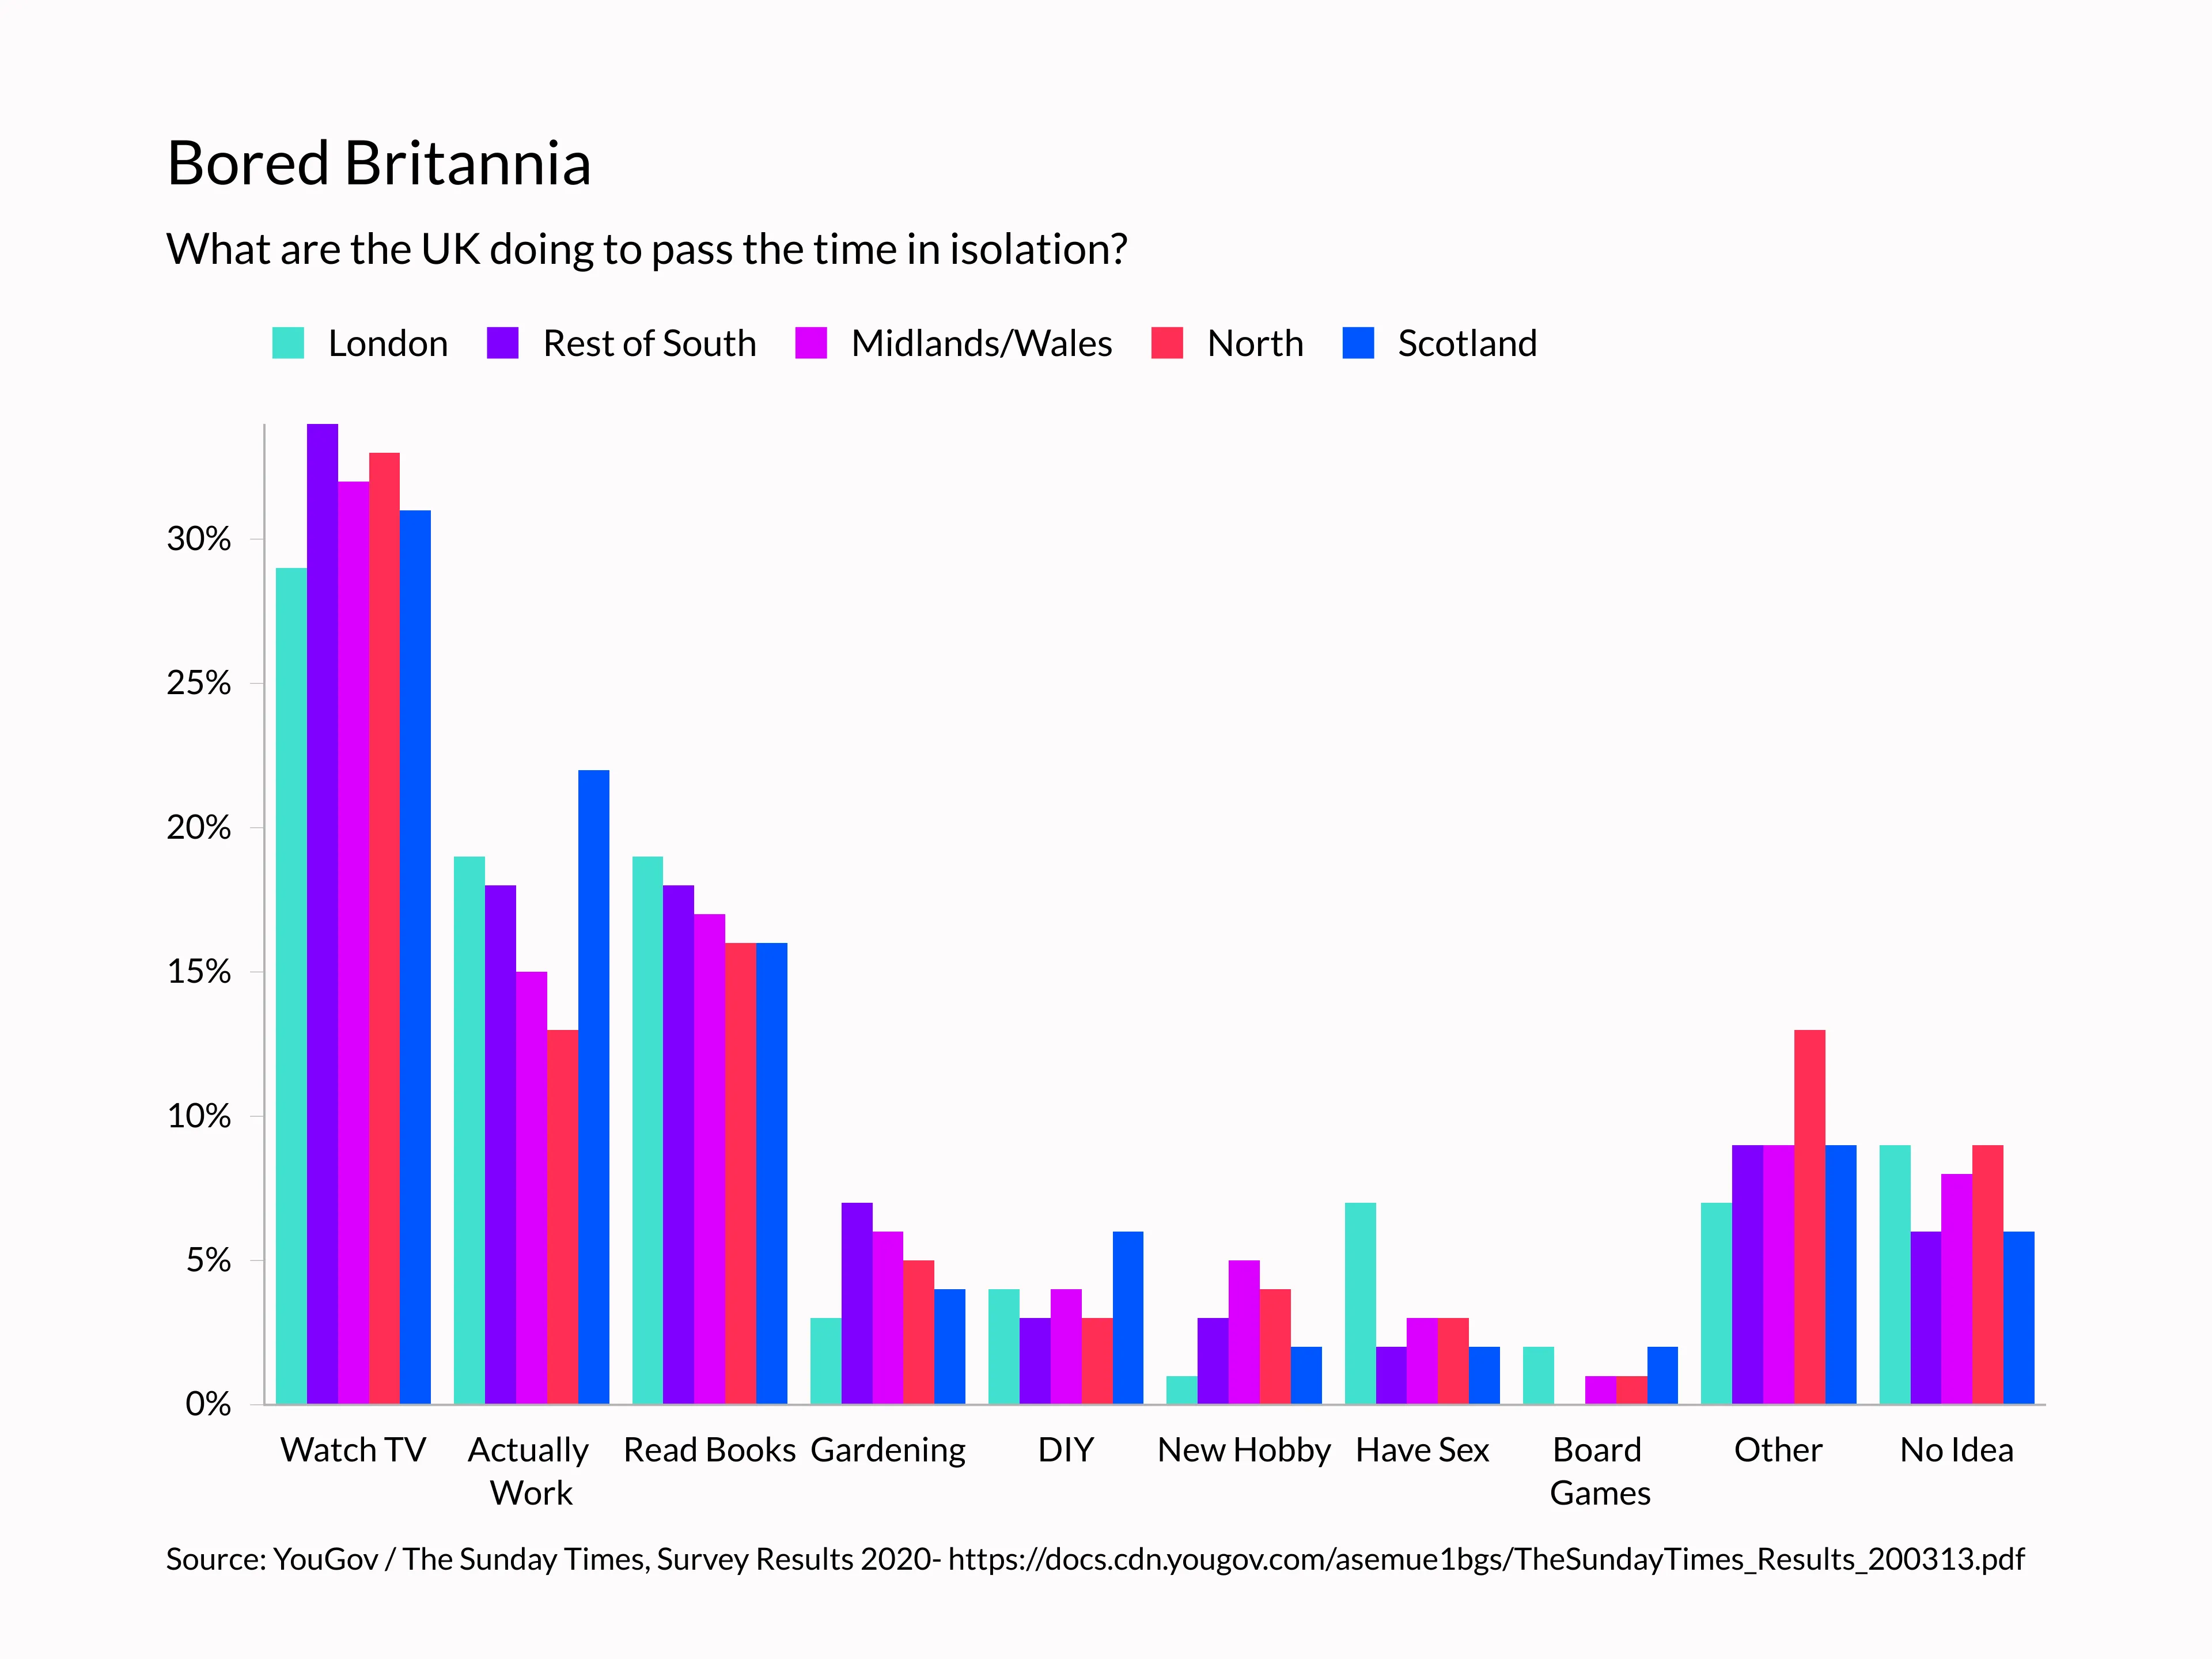
What’s everyone up to?
Well, The Times x YouGov asked that very question of our British cousins, and the answers are illuminating.
Props to Scotland, whose work ethic cannot be stopped by a mere global pandemic as they will spend more time than the rest of the country actually working and fixing up their homes with some DIY.
Londoners appear to be the most literate, and also (coincidentally?) the horniest. Who says books aren’t sexy? In general, though, those talking about a boom of “Corona babies” are going to be sorely disappointed - unless you count a renewed Netflix subscription as part of the family.
The greatest question thrown up by this graph is thus - what y’all doing up North? You clearly have some “Other” plans…
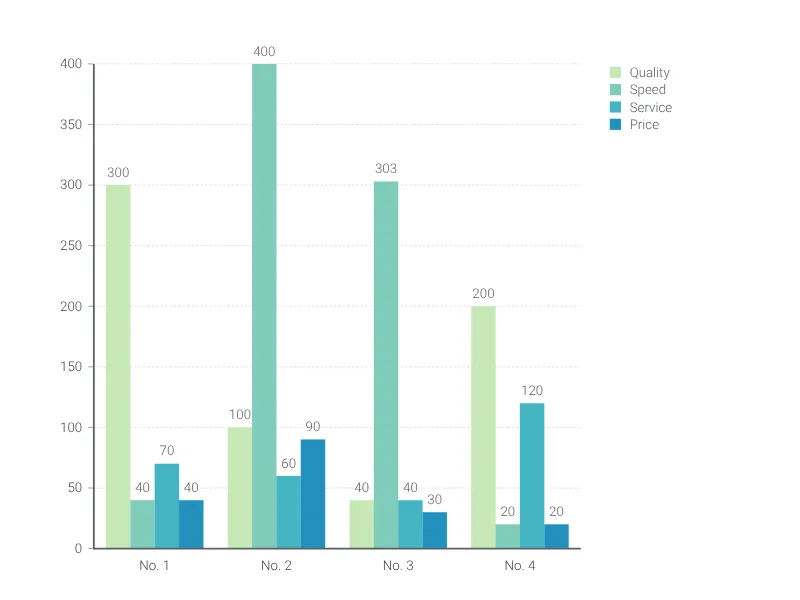
Dies ist ein Beispiel für Vizzlos "Gruppiertes Balkendiagramm"
Verwenden Sie ein gruppiertes Balkendiagramm, um gleiche Kategorien innerhalb verschiedener Gruppen zu vergleichen.
Finanzen & Wirtschaft Vertrieb & Marketing Balken- & Säulendiagramme