VORSCHAU
Chart Vizzard
Vizzlos KI-basierter Diagramm-GeneratorUSA — Employment Change by Industry
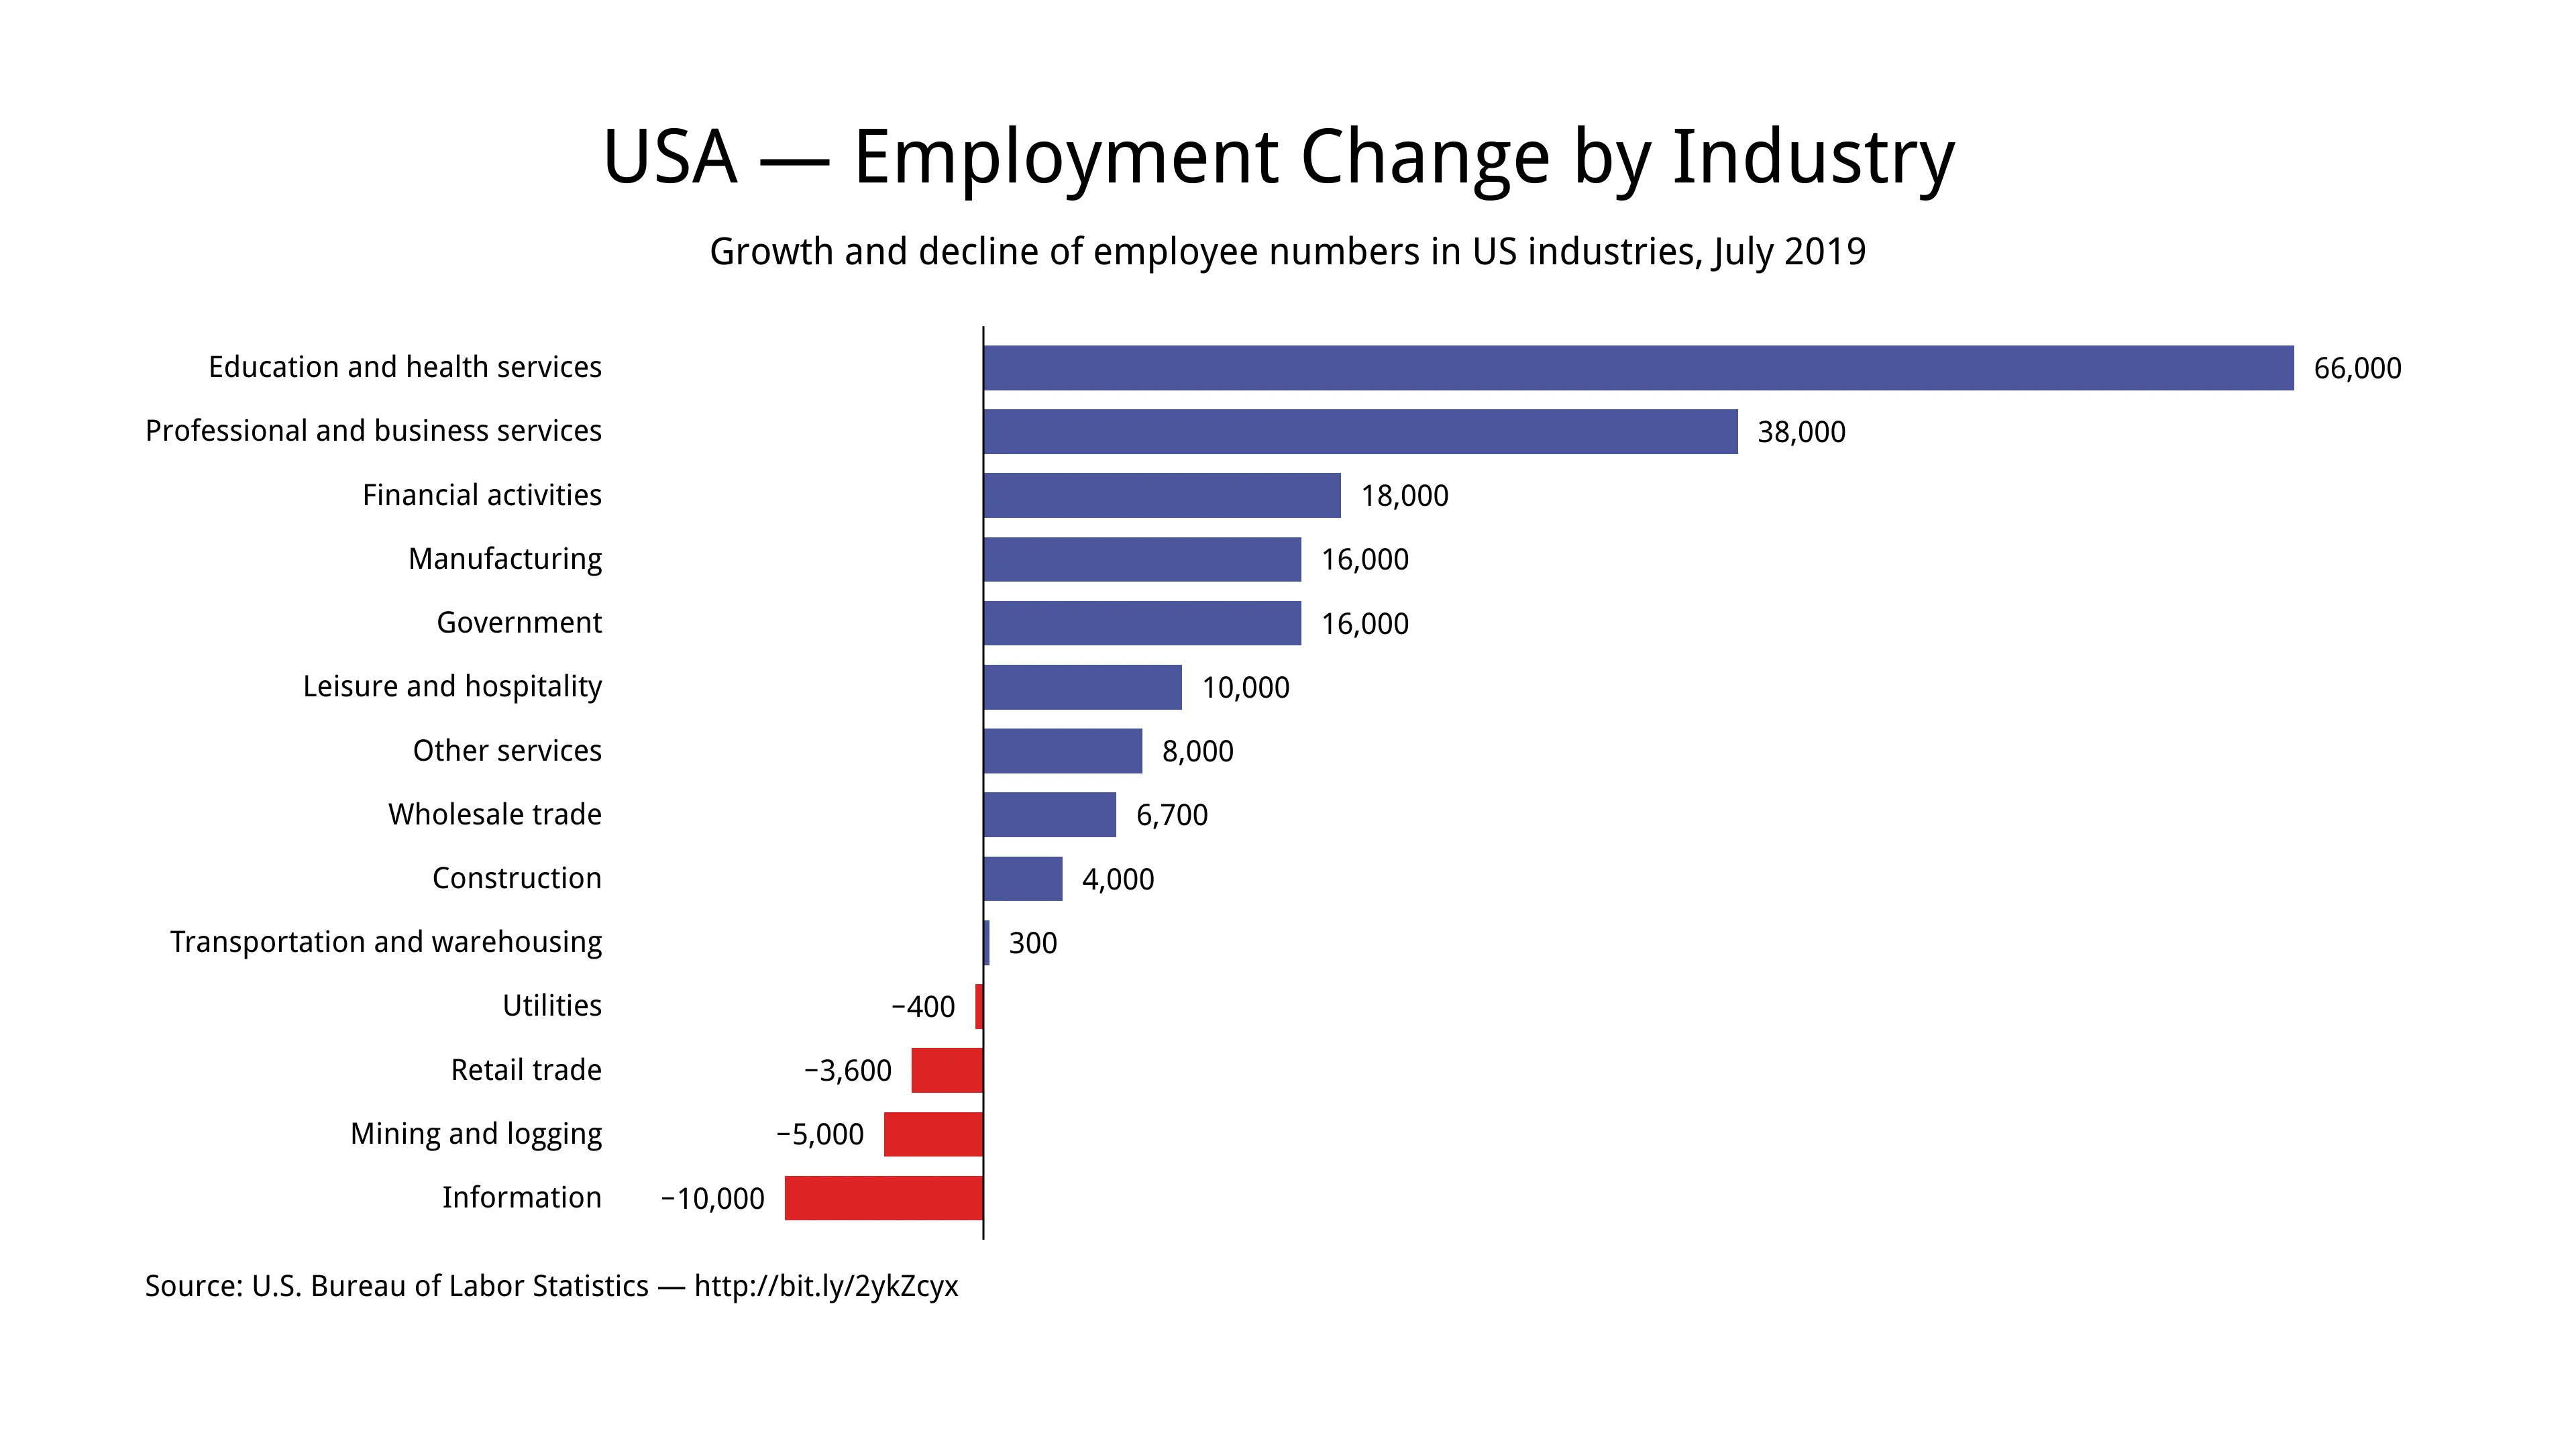
Hit by the hurricanes, the U.S. economy lost 33,000 jobs altogether in September 2017—the first drop since 2010. While some industries are experiencing gains, e.g., health services and transportation, the leisure, and hospitality industries and the affected regions might feel a residual impact of the storms for months. Check this article of the [Washinton Post] (https://www.washingtonpost.com/) to see the bigger picture: [U.S. economy loses 33,000 jobs after hurricanes, first decline in seven years. But unemployment falls to 4.2 percent] (http://wapo.st/2yIFu0H).
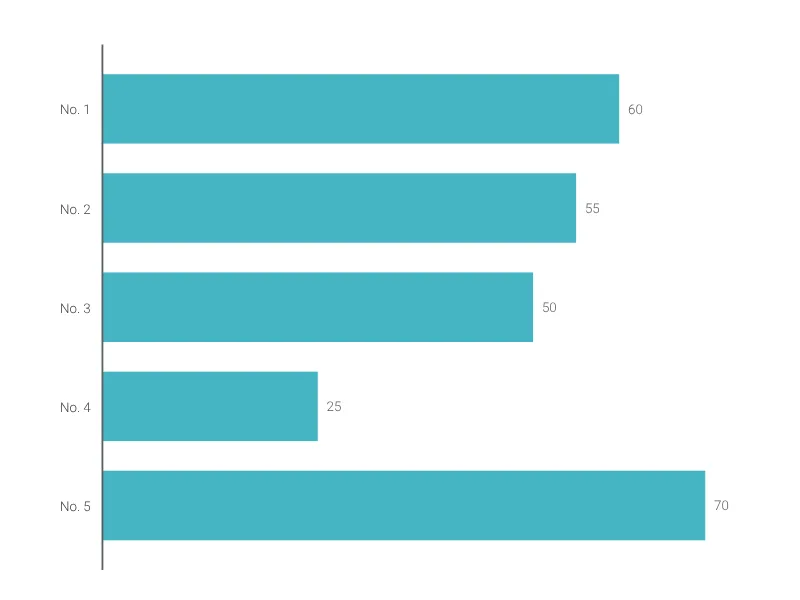
Dies ist ein Beispiel für Vizzlos "Horizontales Balkendiagramm"
Eine horizontale Variante des klassischen Säulendiagramms.