VORSCHAU
Chart Vizzard
Vizzlos KI-basierter Diagramm-GeneratorSixty Seconds in Social Media
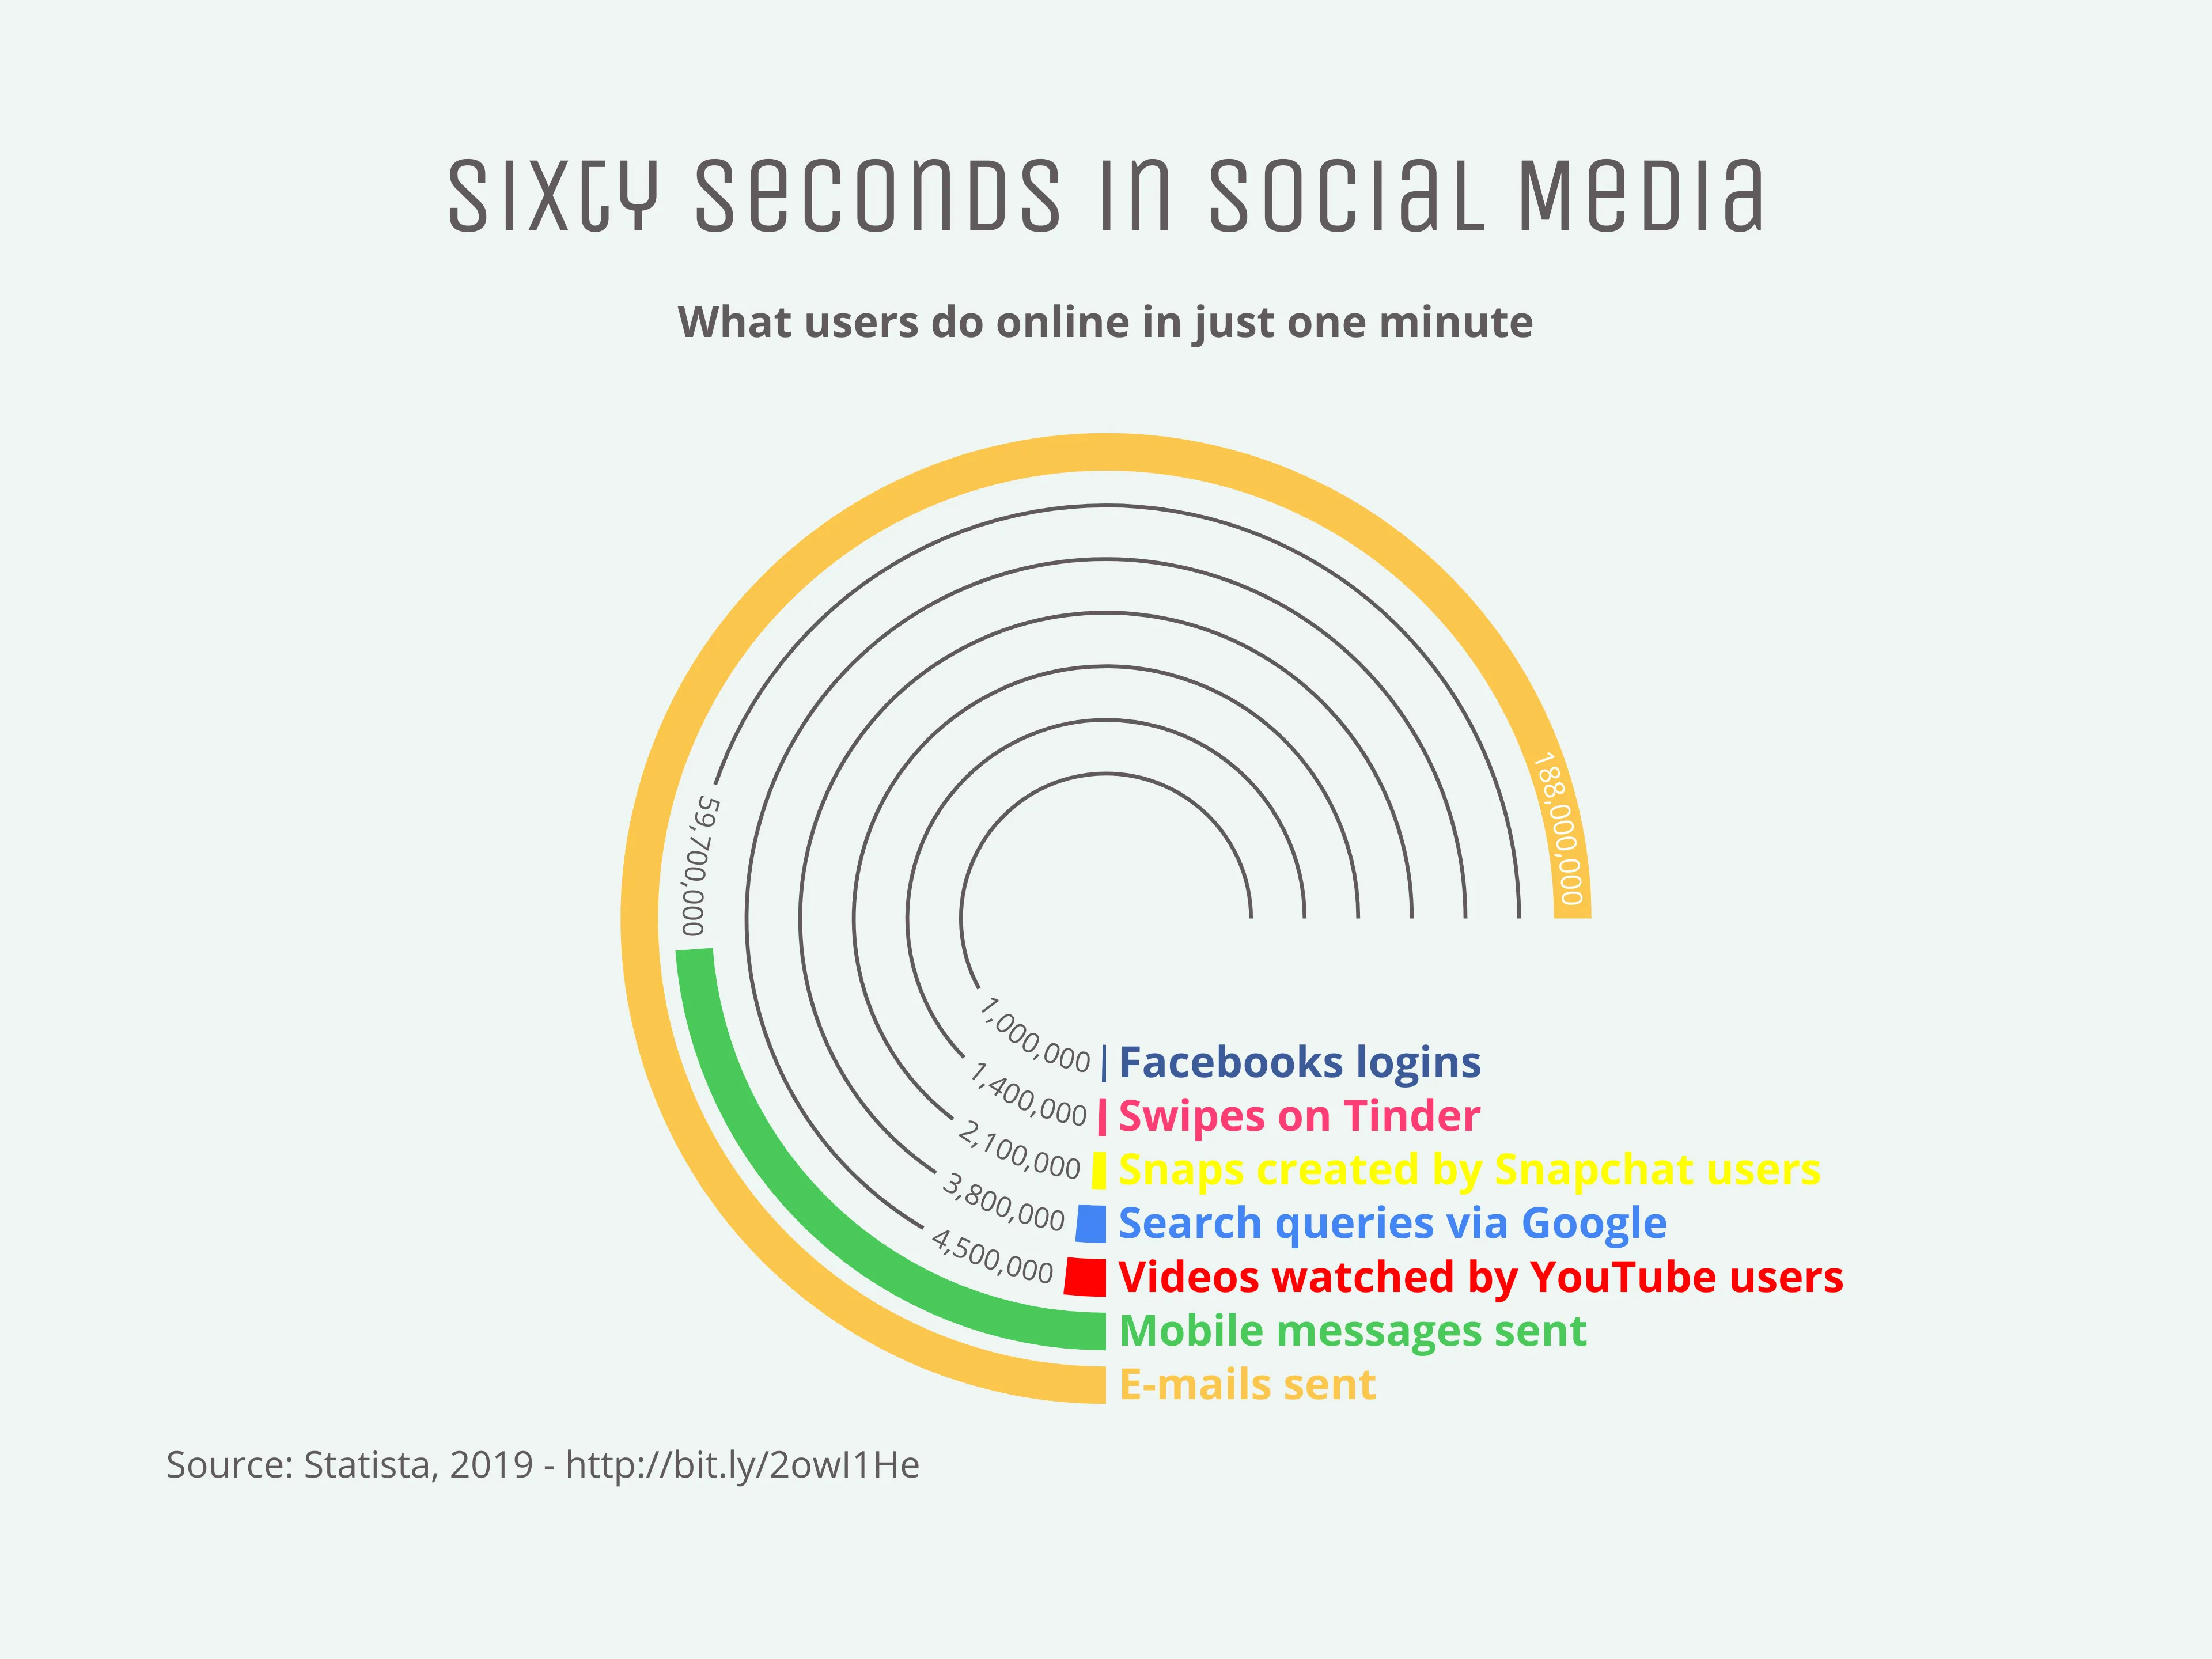
Did you know that the average Millenial checks their phone 221 times per day?! A minute seems like a fleeting moment, but not on the internet; we send and receive an enormous amount of information in that time. In today’s Radial Bar Chart we’re looking at our online behaviour in numbers: hundreds of millions of messages are sent, millions of social media news feeds are scrolled through and hundreds of thousands of hours of content are consumed in just sixty seconds.
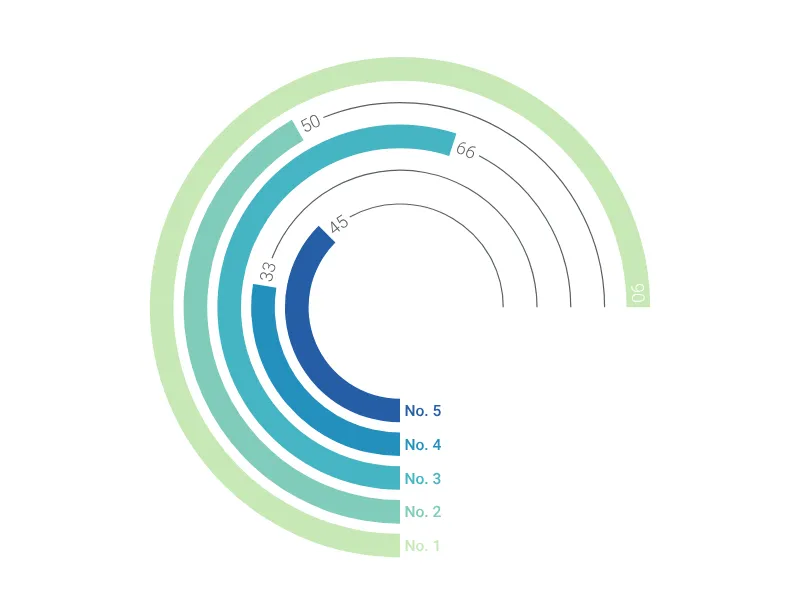
Dies ist ein Beispiel für Vizzlos "Radiales Balkendiagramm"
Dieses kreisförmige Balkendiagramm ist so stilvoll wie möglich für Ihre nächste Präsentation.
Balken- & Säulendiagramme Kreisdiagramme Messanzeigen- & Statusdiagramme