VORSCHAU
Chart Vizzard
Vizzlos KI-basierter Diagramm-GeneratorWhat do people do on Facebook?
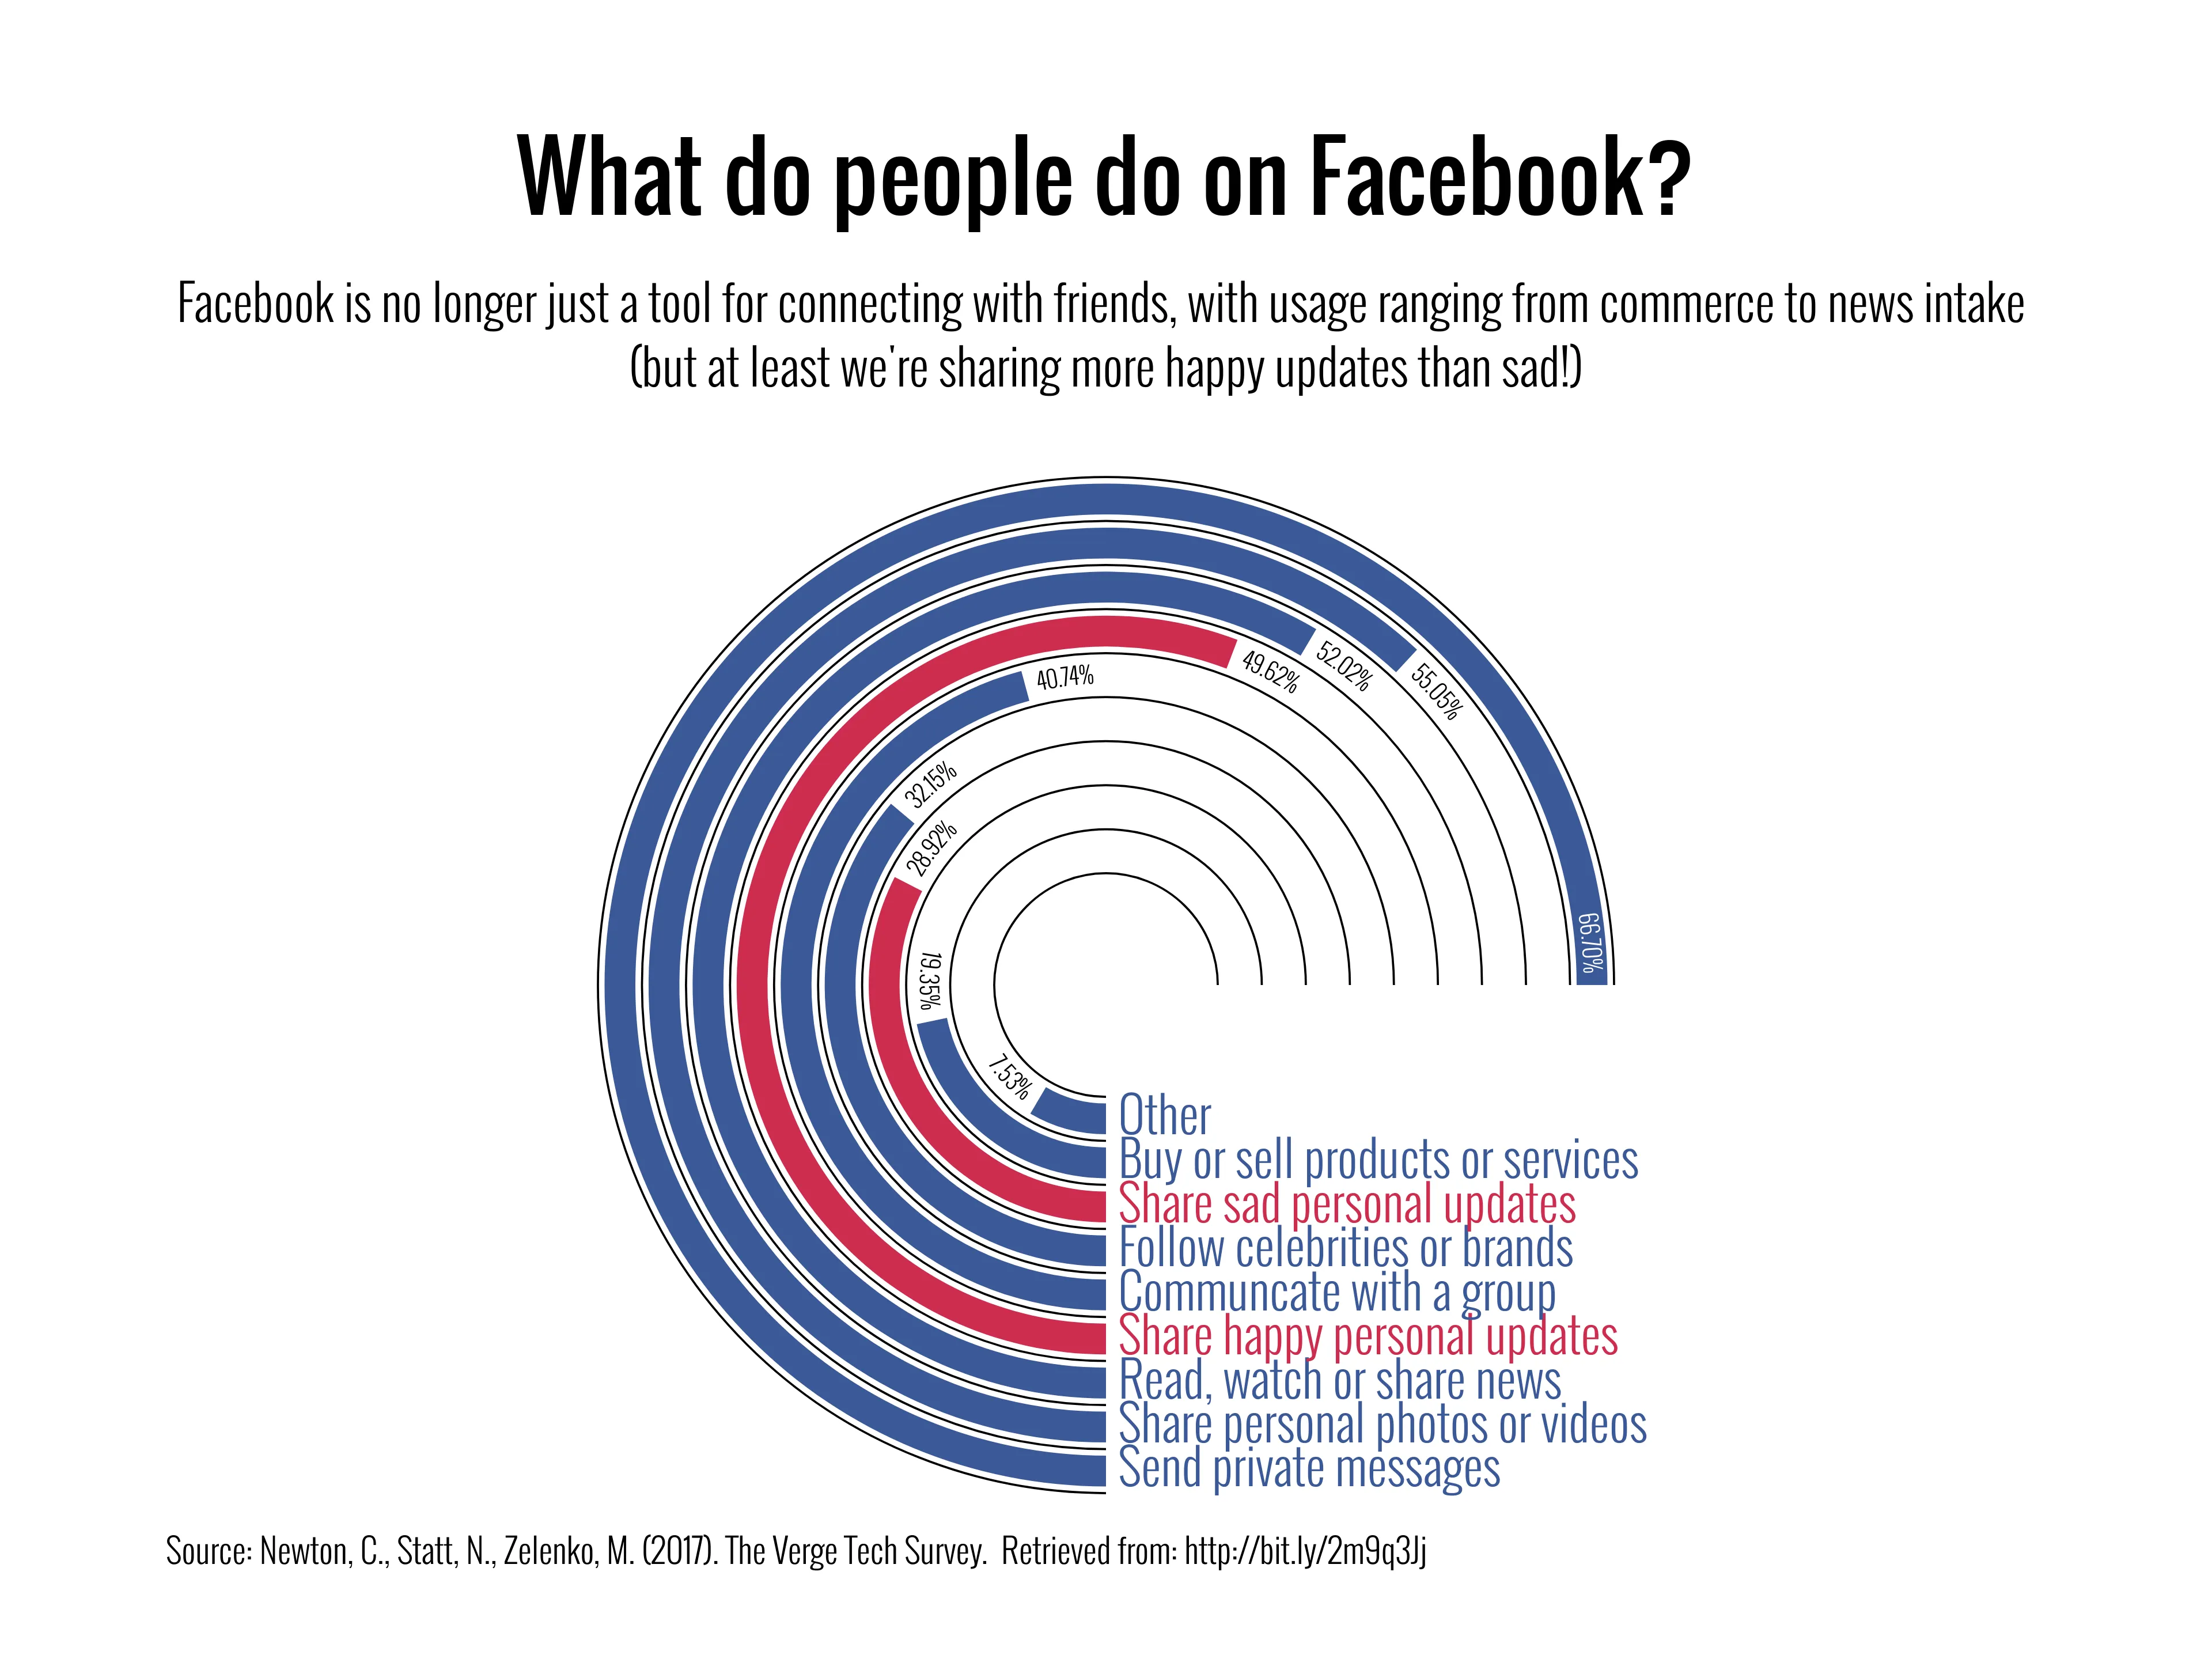
In a year in which fake news profiles and Russian Propaganda on Facebook were unveiled, and political statements and dialog happen on Twitter, the online technology news publication [The Verge] (https://www.theverge.com) surveyed to learn how Americans feel about the most prominent tech brands. Partnered with the [Reticle Research] (http://www.reticleresearch.com/), they’ve asked 1,520 people across the USA about how they trust, relate and use the services and products of these companies.
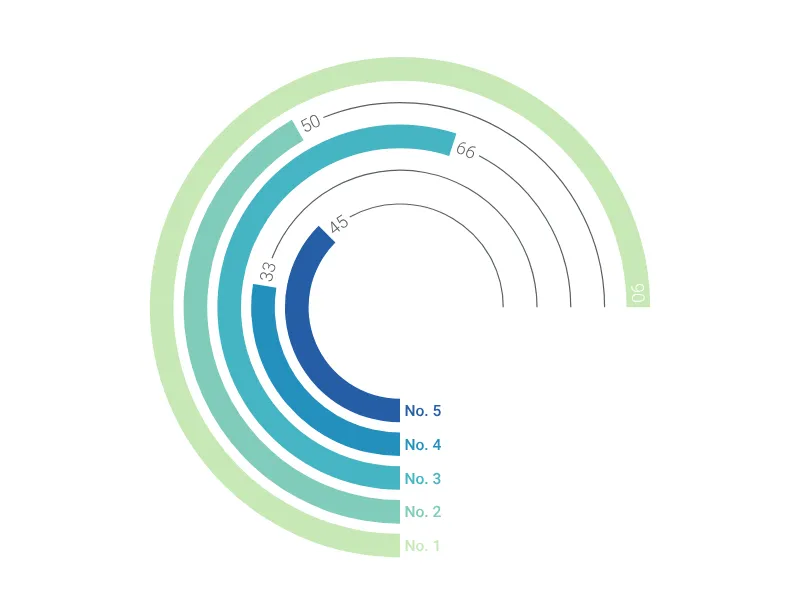
Dies ist ein Beispiel für Vizzlos "Radiales Balkendiagramm"
Dieses kreisförmige Balkendiagramm ist so stilvoll wie möglich für Ihre nächste Präsentation.
Balken- & Säulendiagramme Kreisdiagramme Messanzeigen- & Statusdiagramme