Chart Vizzard
Vizzlos KI-basierter Diagramm-GeneratorMicrosoft's Income Statement
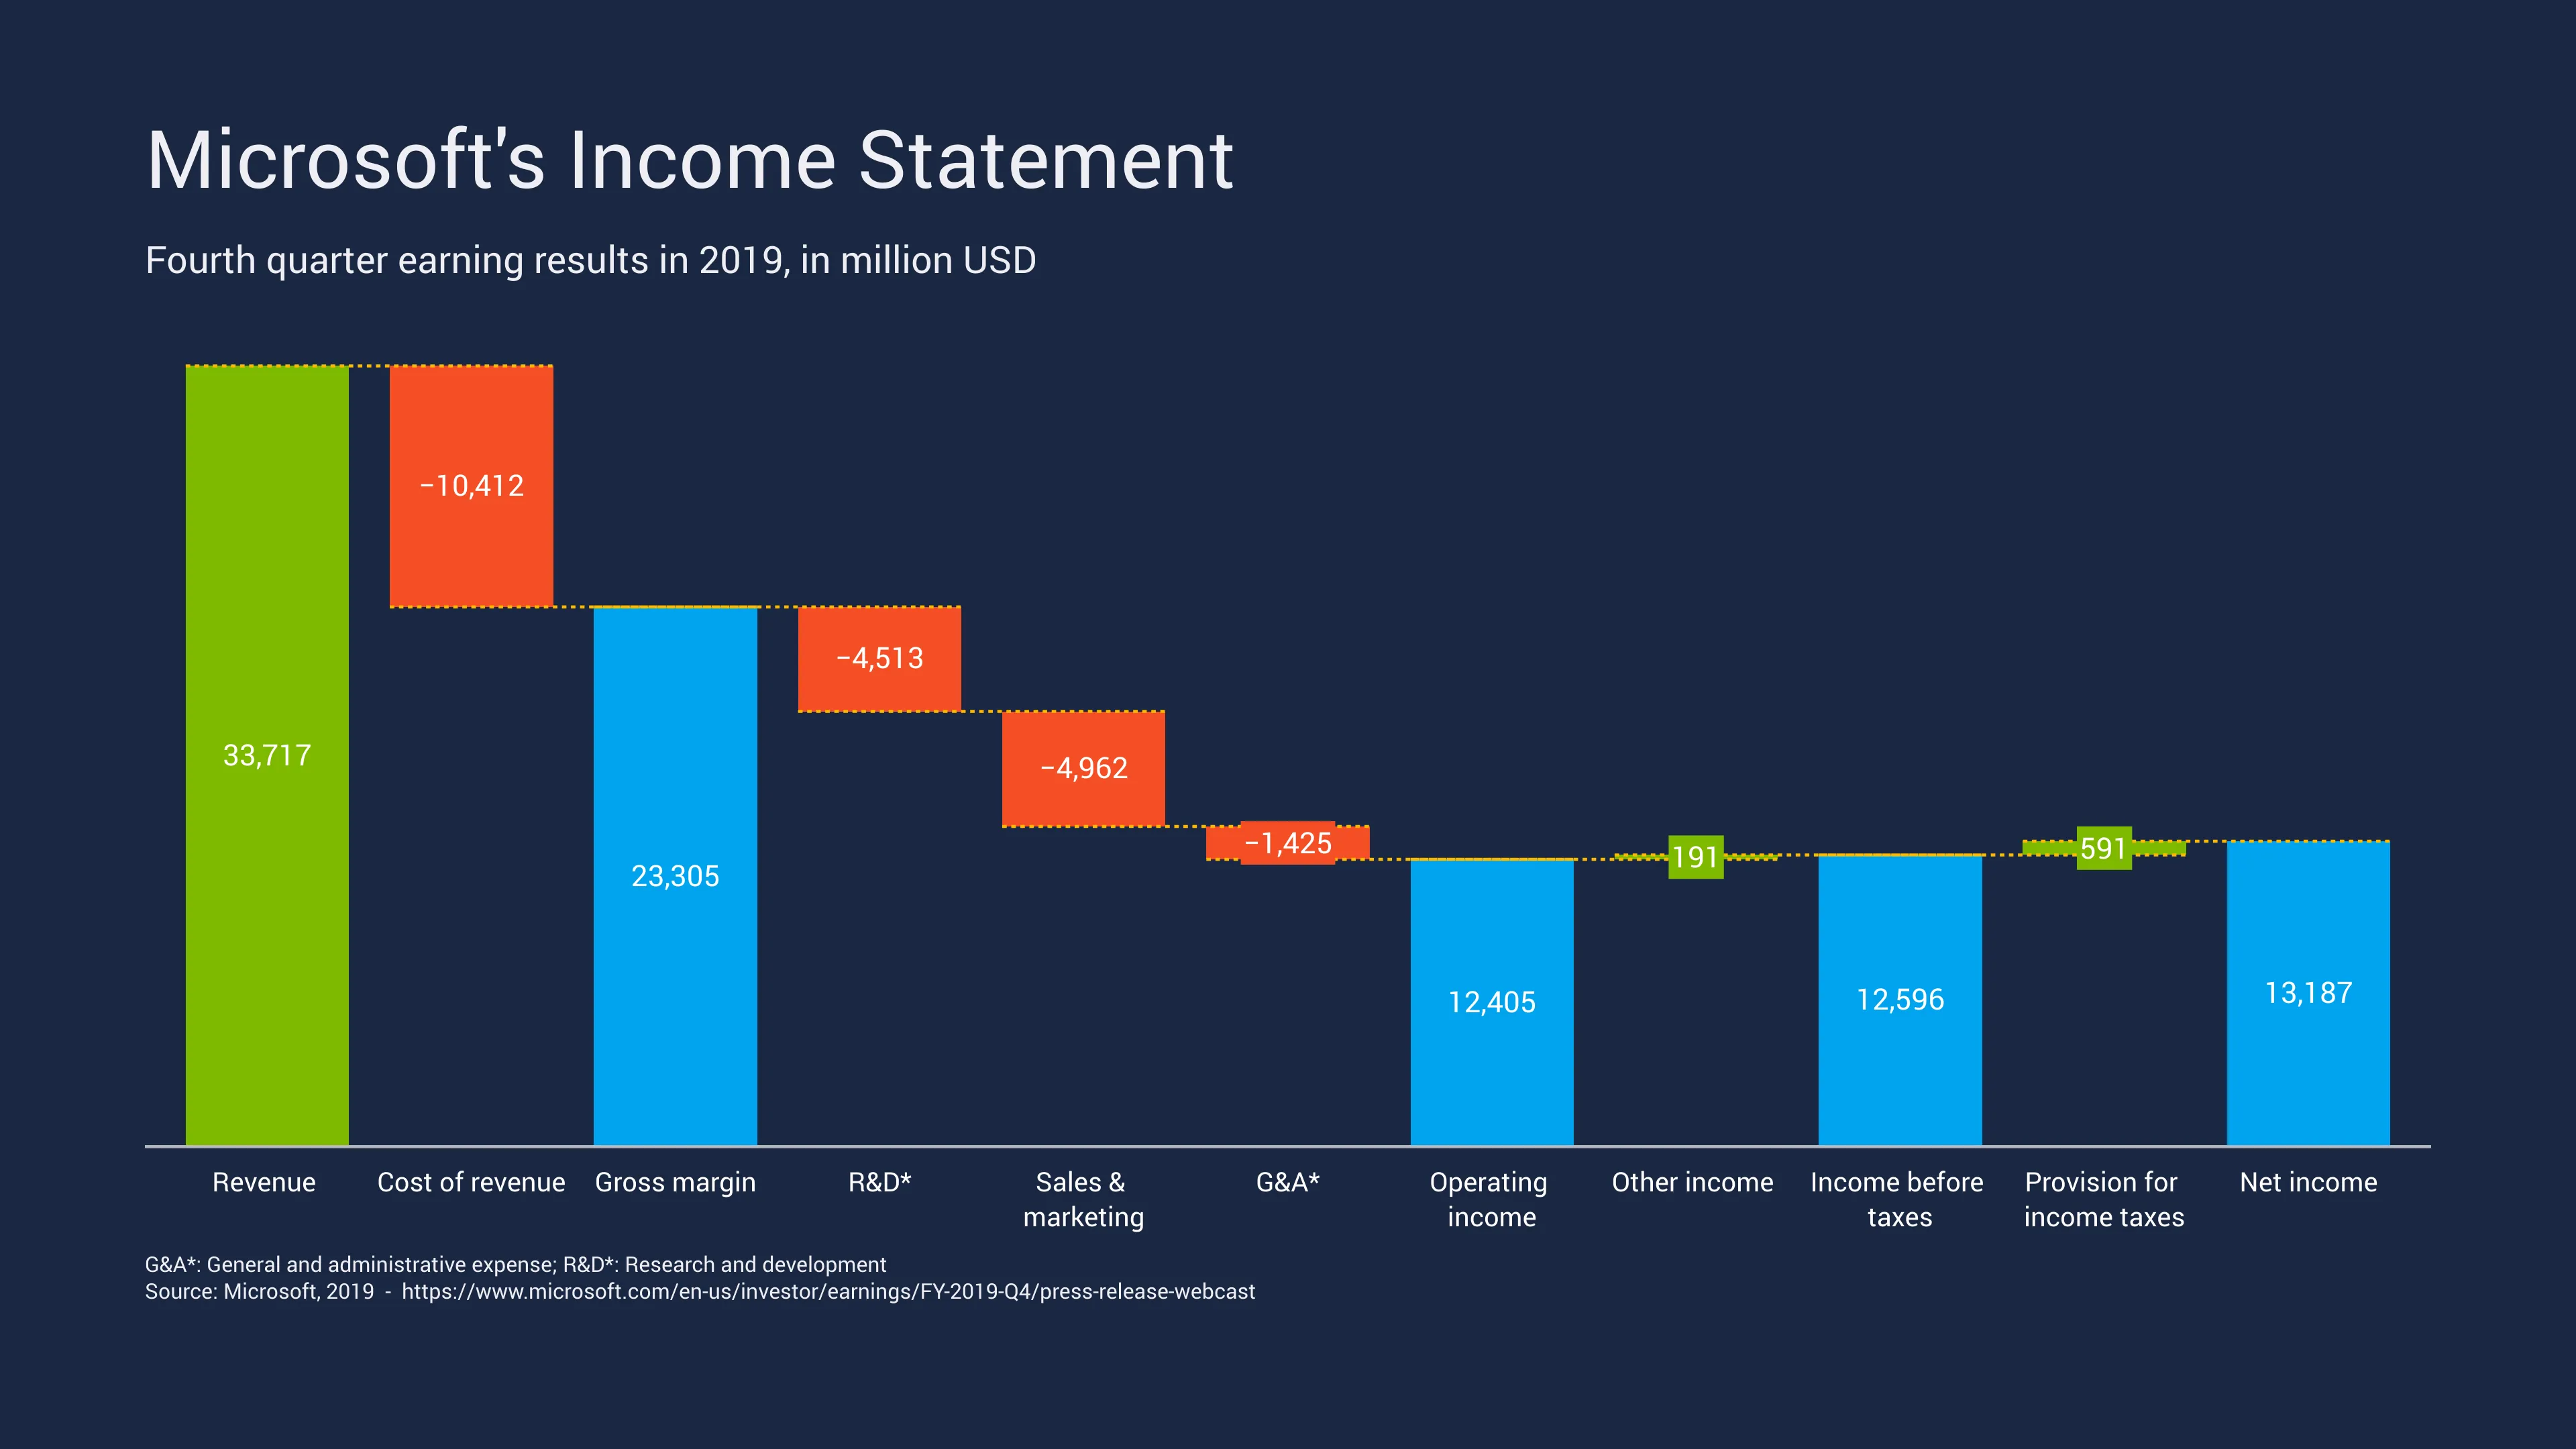
Microsoft is back with its latest event, which took place in New York on October 2nd, 2019. The tech company announced the expected Surface Laptop during the event, as well as a new category of dual-screen devices built for mobile productivity. In this waterfall chart we show the income statement for the quarter ending in June 2019 of one of the world’s most valuable listed companies. Revenue at the end of the quarter was $33.7 billion and increased by 12% compared to the same quarter of 2018. On the other hand, operating income was $12.4 billion and increased by 20% and net income was $13.2 billion GAAP and $10.6 billion non-GAAP, and increased 49% and 21%, respectively.
Dies ist ein Beispiel für Vizzlos "Wasserfalldiagramm"
Säulendiagramm, mit dem die Veränderung eines Anfangswertes durch eine Serie von weiteren Werten visualisiert werden kann.