VORSCHAU
Chart Vizzard
Vizzlos KI-basierter Diagramm-GeneratorUS Dollars in Circulation
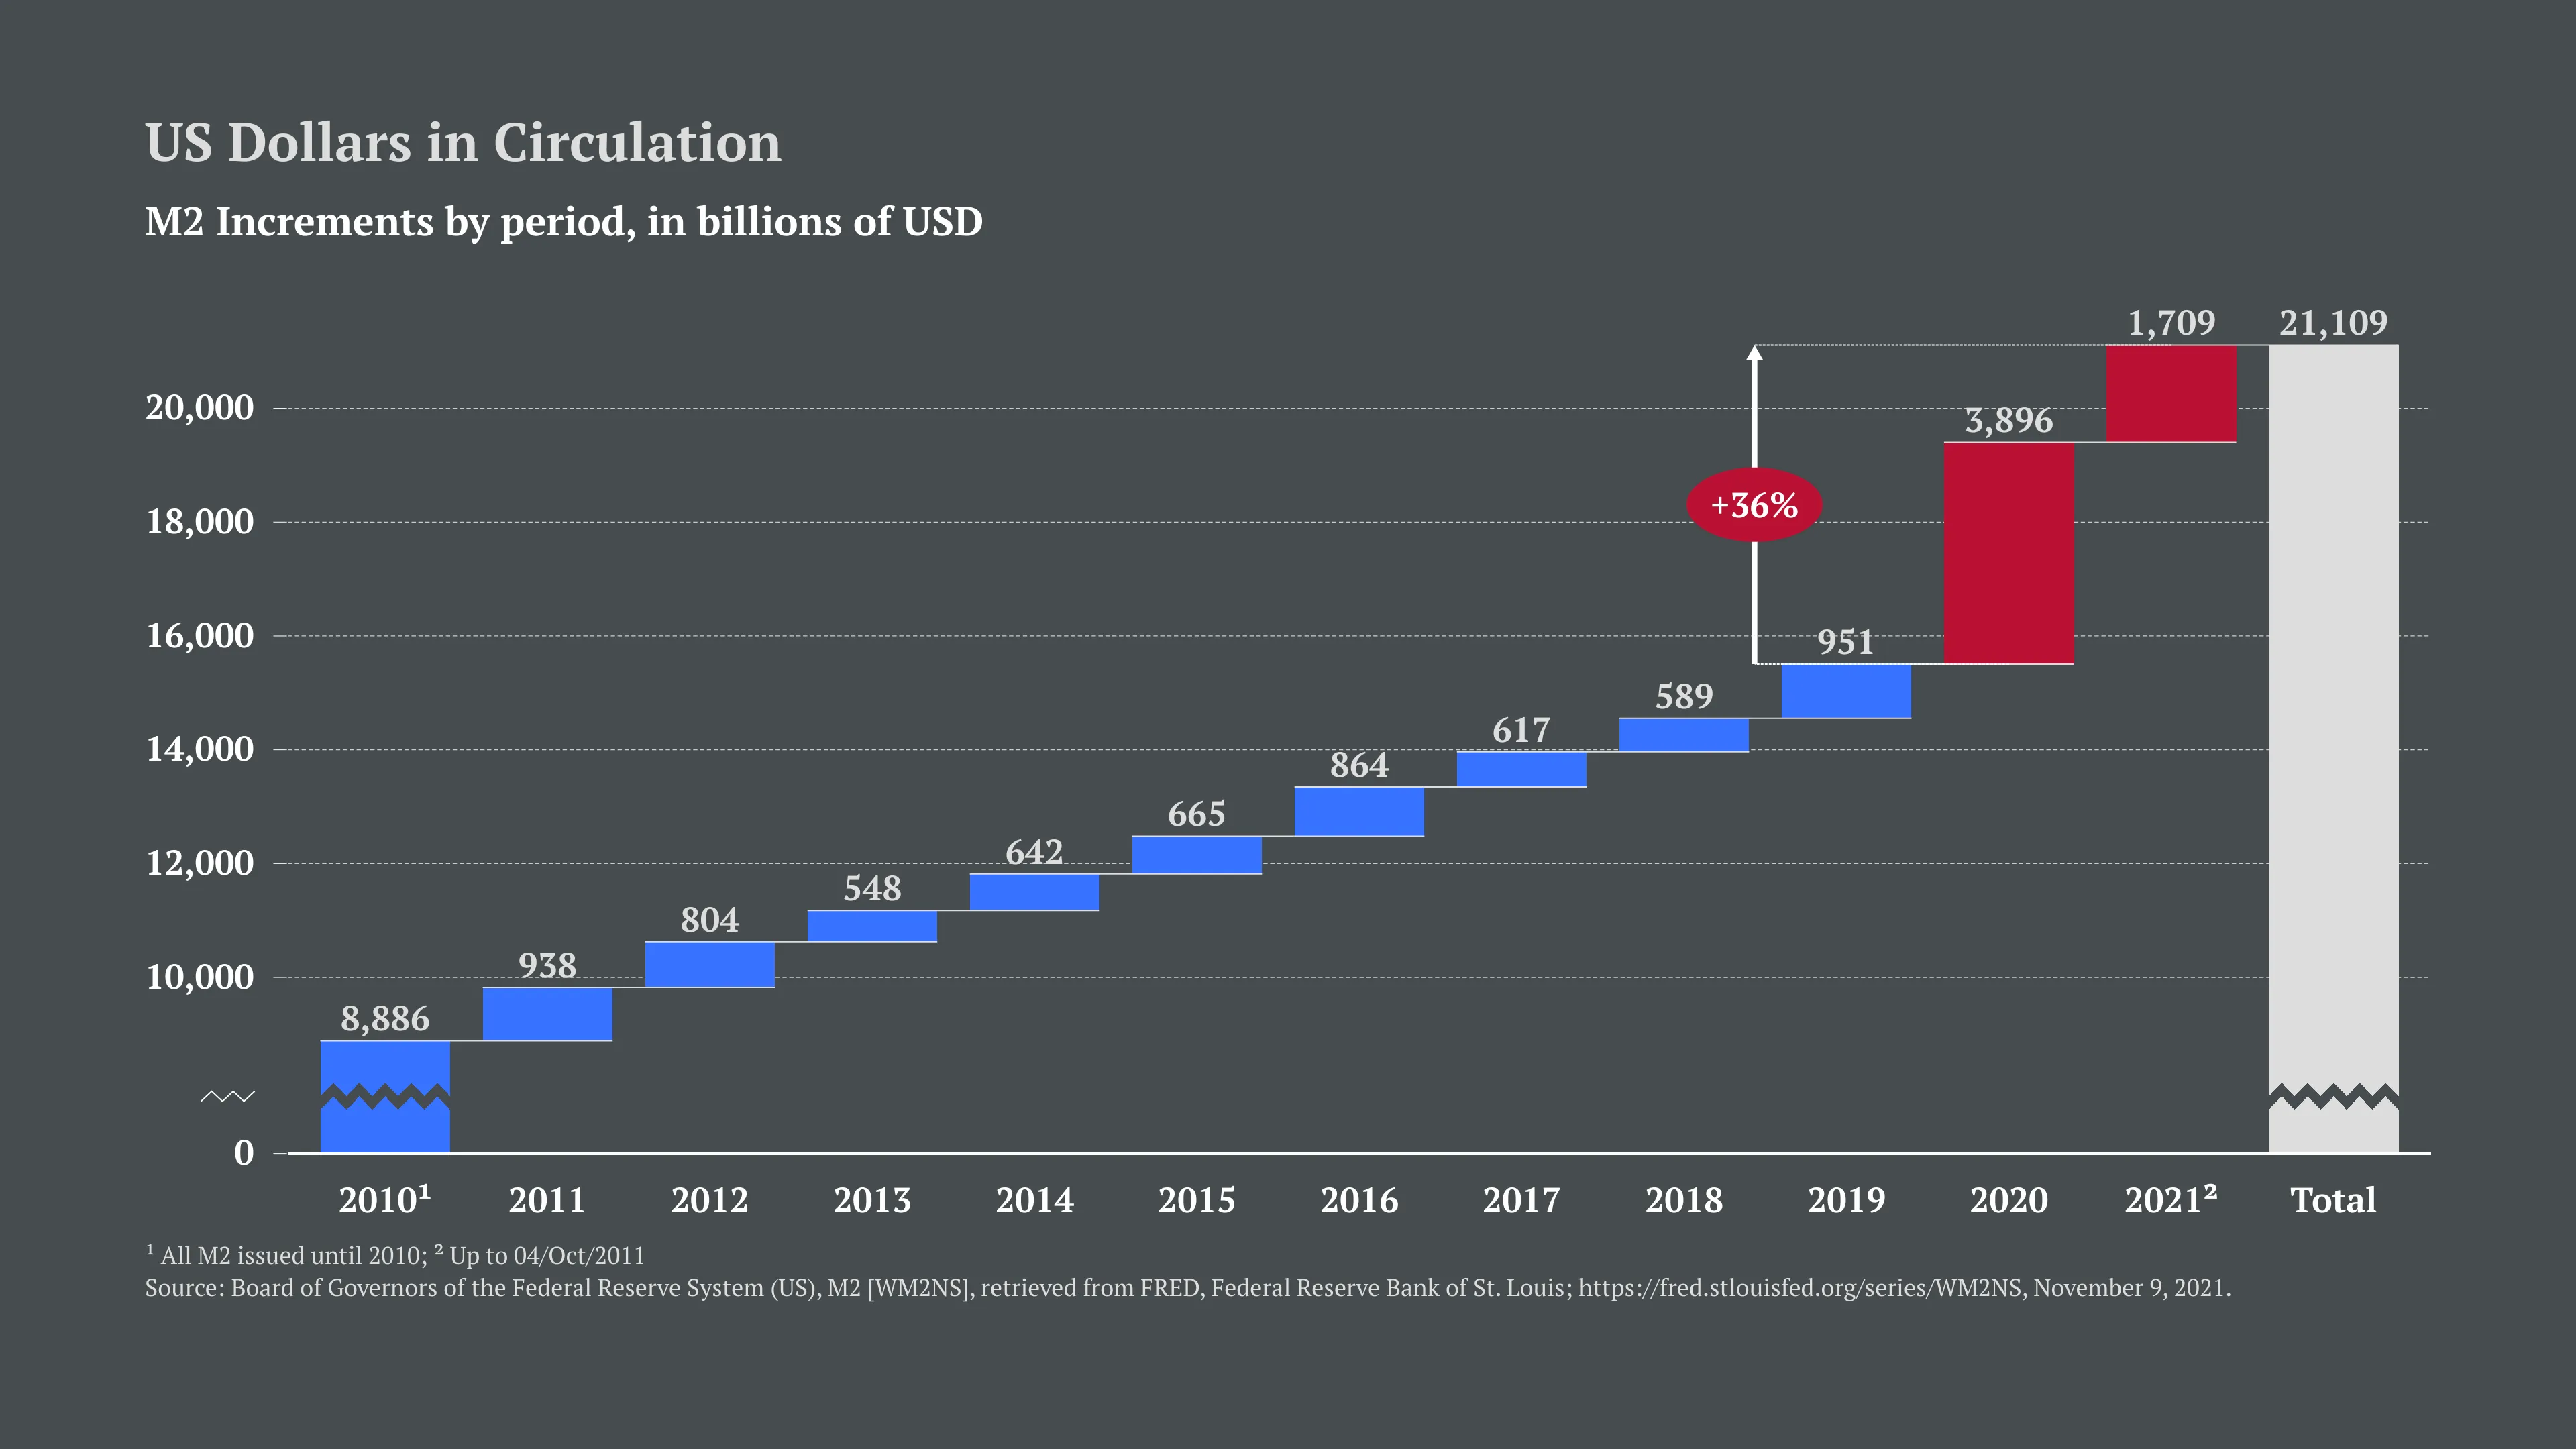
This chart shows the increases in the US Dollars M2 in the last few years. The M2 is the measure of all the money supply in circulation and includes cash, savings and bank deposits. Basically, it’s the amount of money available for people to spend.
Manipulation of the money supply is one of the key weapons Central Banks have at their disposal to fight crises and unemployment - and this was used by the Fed during the Covid outbreak: roughly one third of all the existent US dollars were put in circulation after 2020.
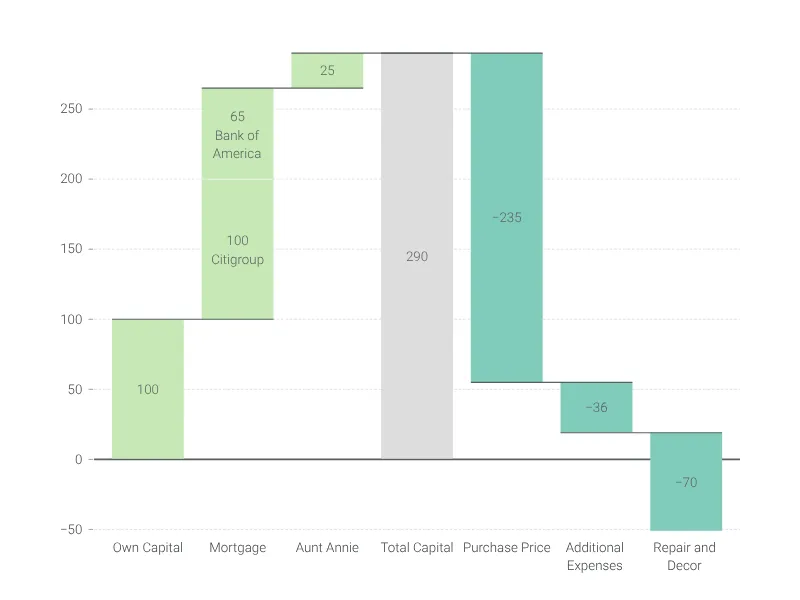
Dies ist ein Beispiel für Vizzlos "Wasserfalldiagramm"
Säulendiagramm, mit dem die Veränderung eines Anfangswertes durch eine Serie von weiteren Werten visualisiert werden kann.