Chart Vizzard
Vizzlos KI-basierter Diagramm-GeneratorInstagrams biggest Earners
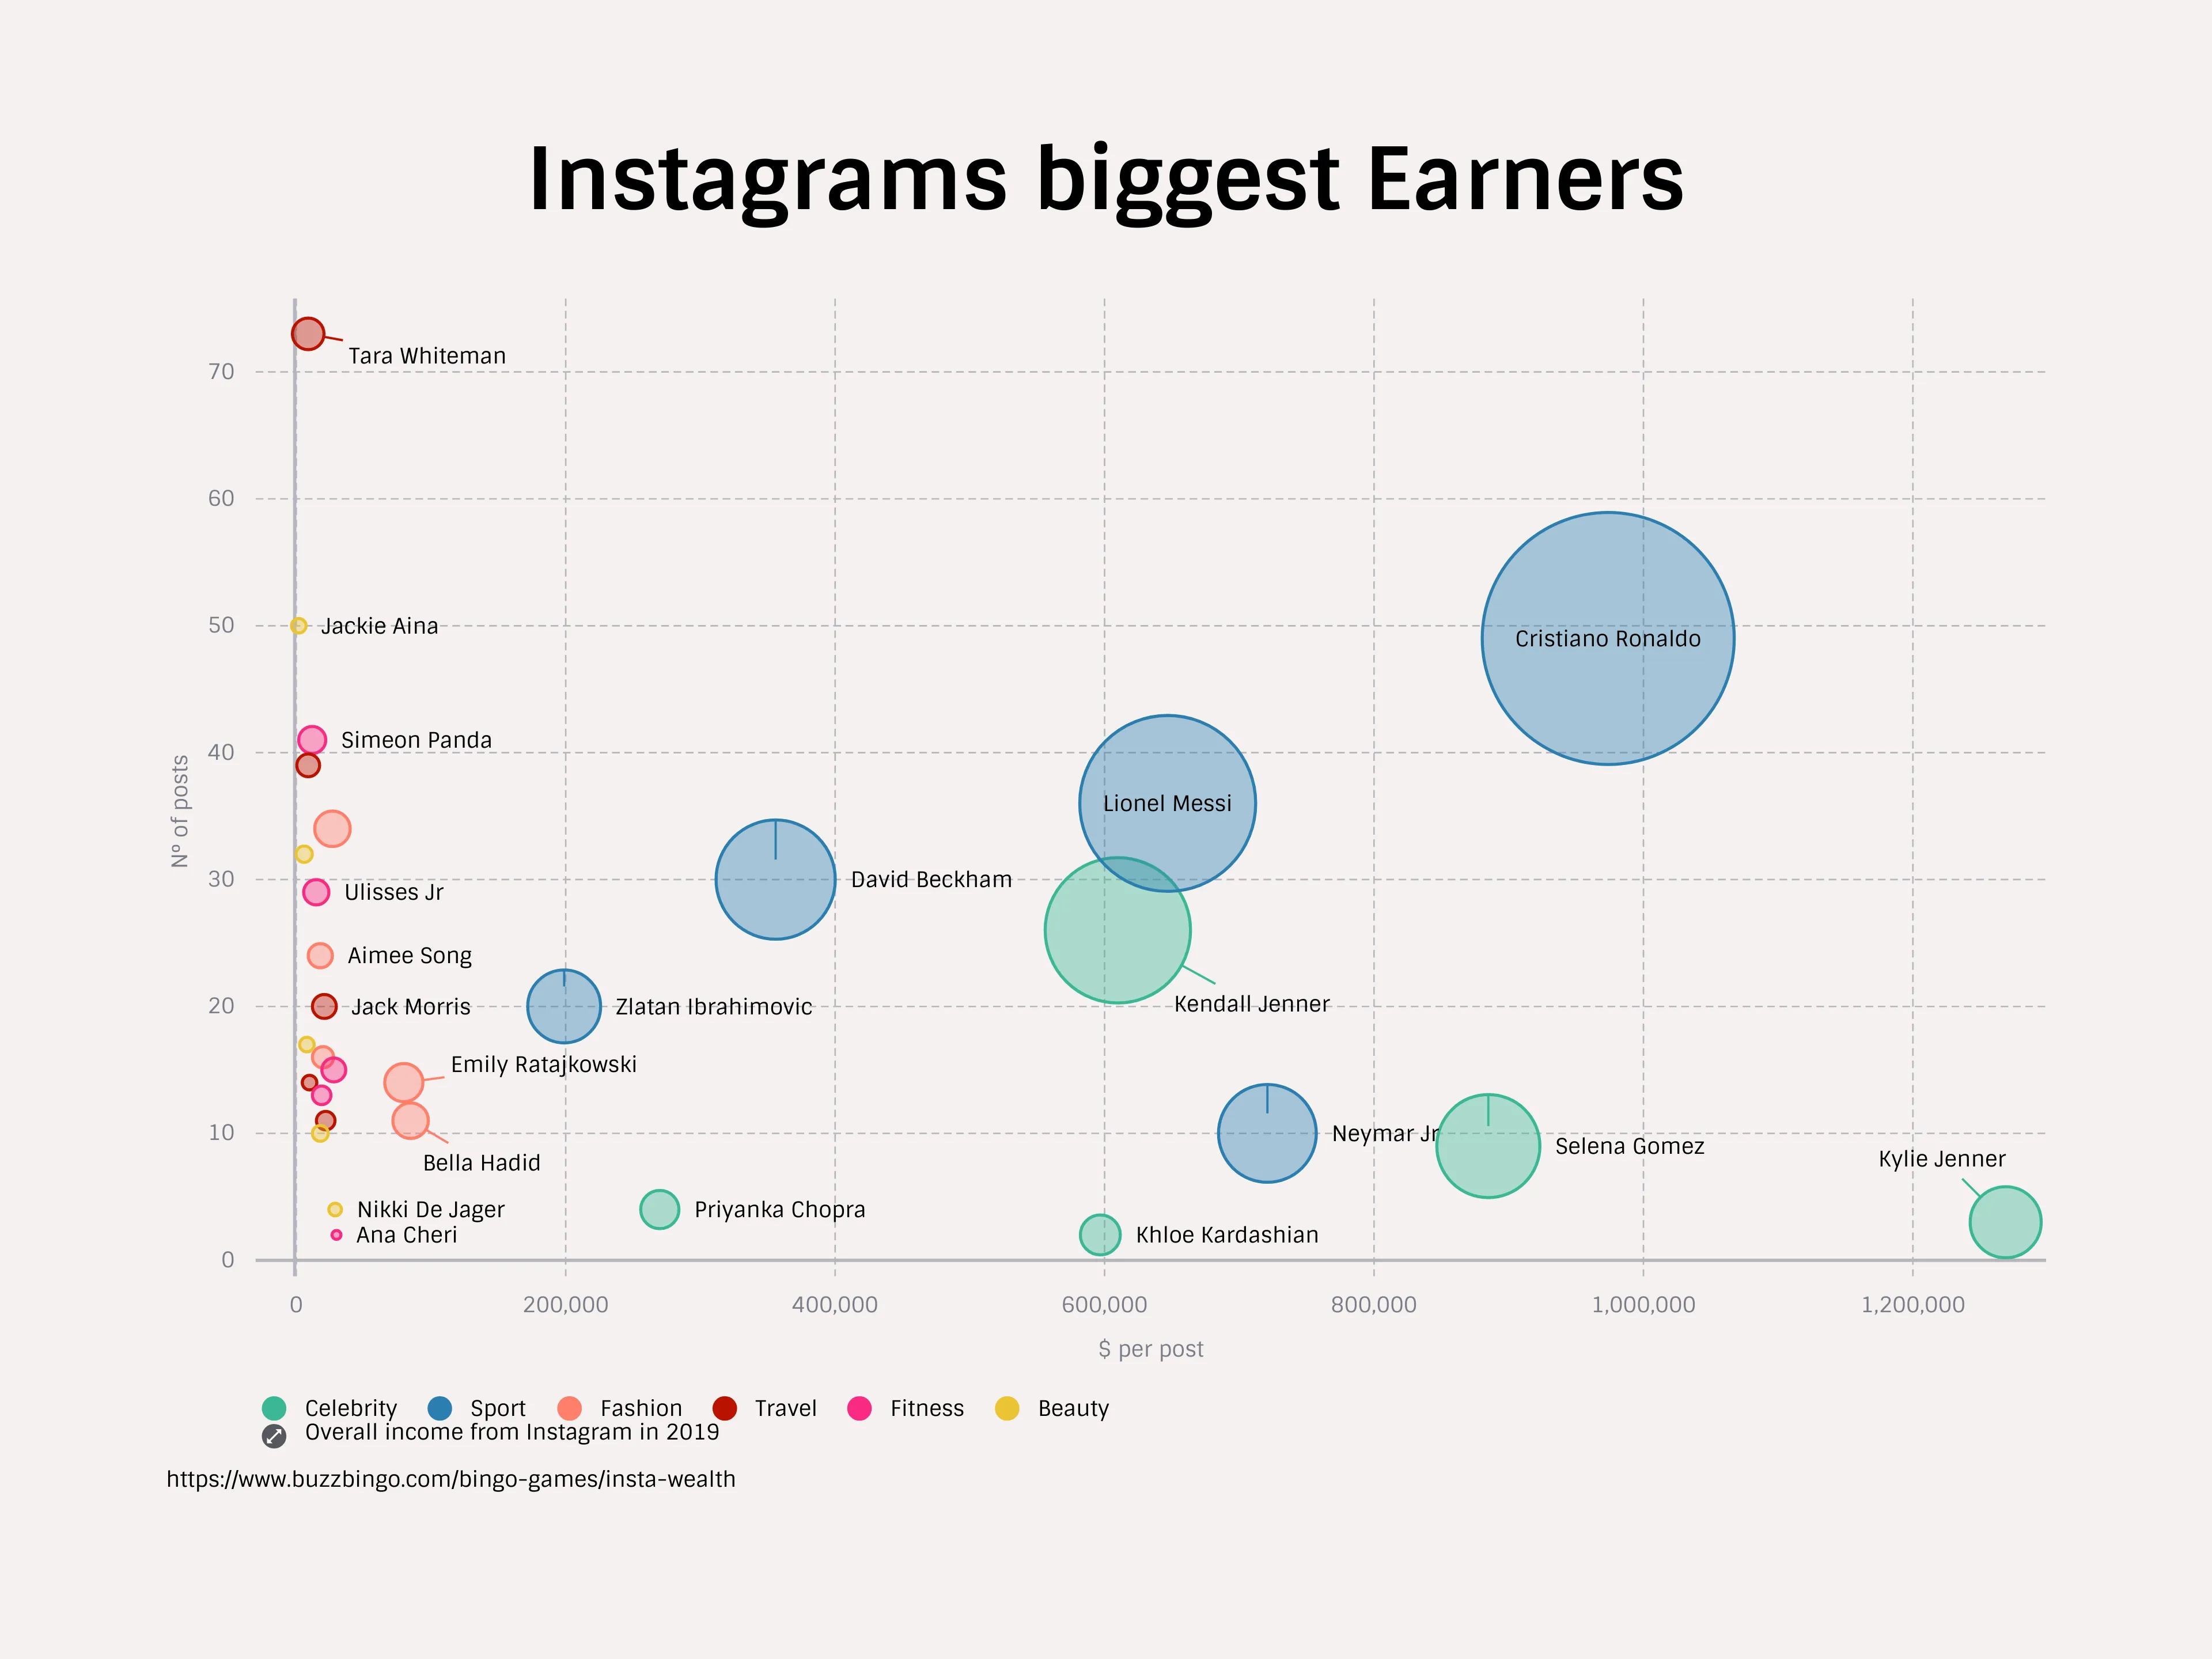
With Instagram getting rid of likes under posts, a lot of influencers are concerned about their accounts and their ability to continue making a living with them, we decided to check how well the top influencers of their respective resort are actually doing.
Todays Bubble Chart plots the income of the top earners on instagram, according to the number of posts in 2019, the revenue per post and the overall money earned over the last years. The chart suggests that, while most people on this list make a good earning, it might actually the “professional influencers” that could struggle the most. Since sports stars and celebrities have fr eclipsed them in terms of earnings from the platform.
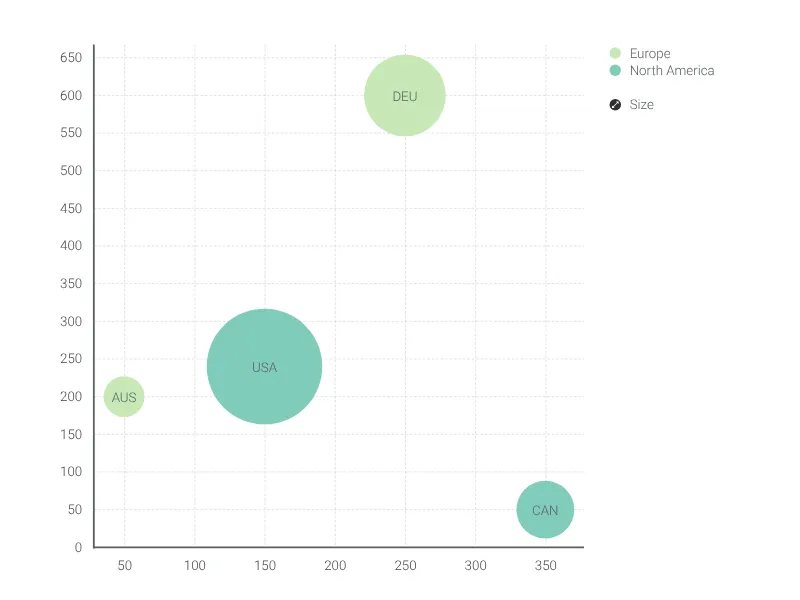
Dies ist ein Beispiel für Vizzlos "Blasendiagramm"
Ein multivariables Diagramm zur Visualisierung und zum Vergleich von bis zu vier Dimensionen Ihrer Daten.
Finanzen & Wirtschaft Vertrieb & Marketing Streudiagramme & Blasendiagramme