Chart Vizzard
Vizzlos KI-basierter Diagramm-GeneratorThe iPhone Index 2021
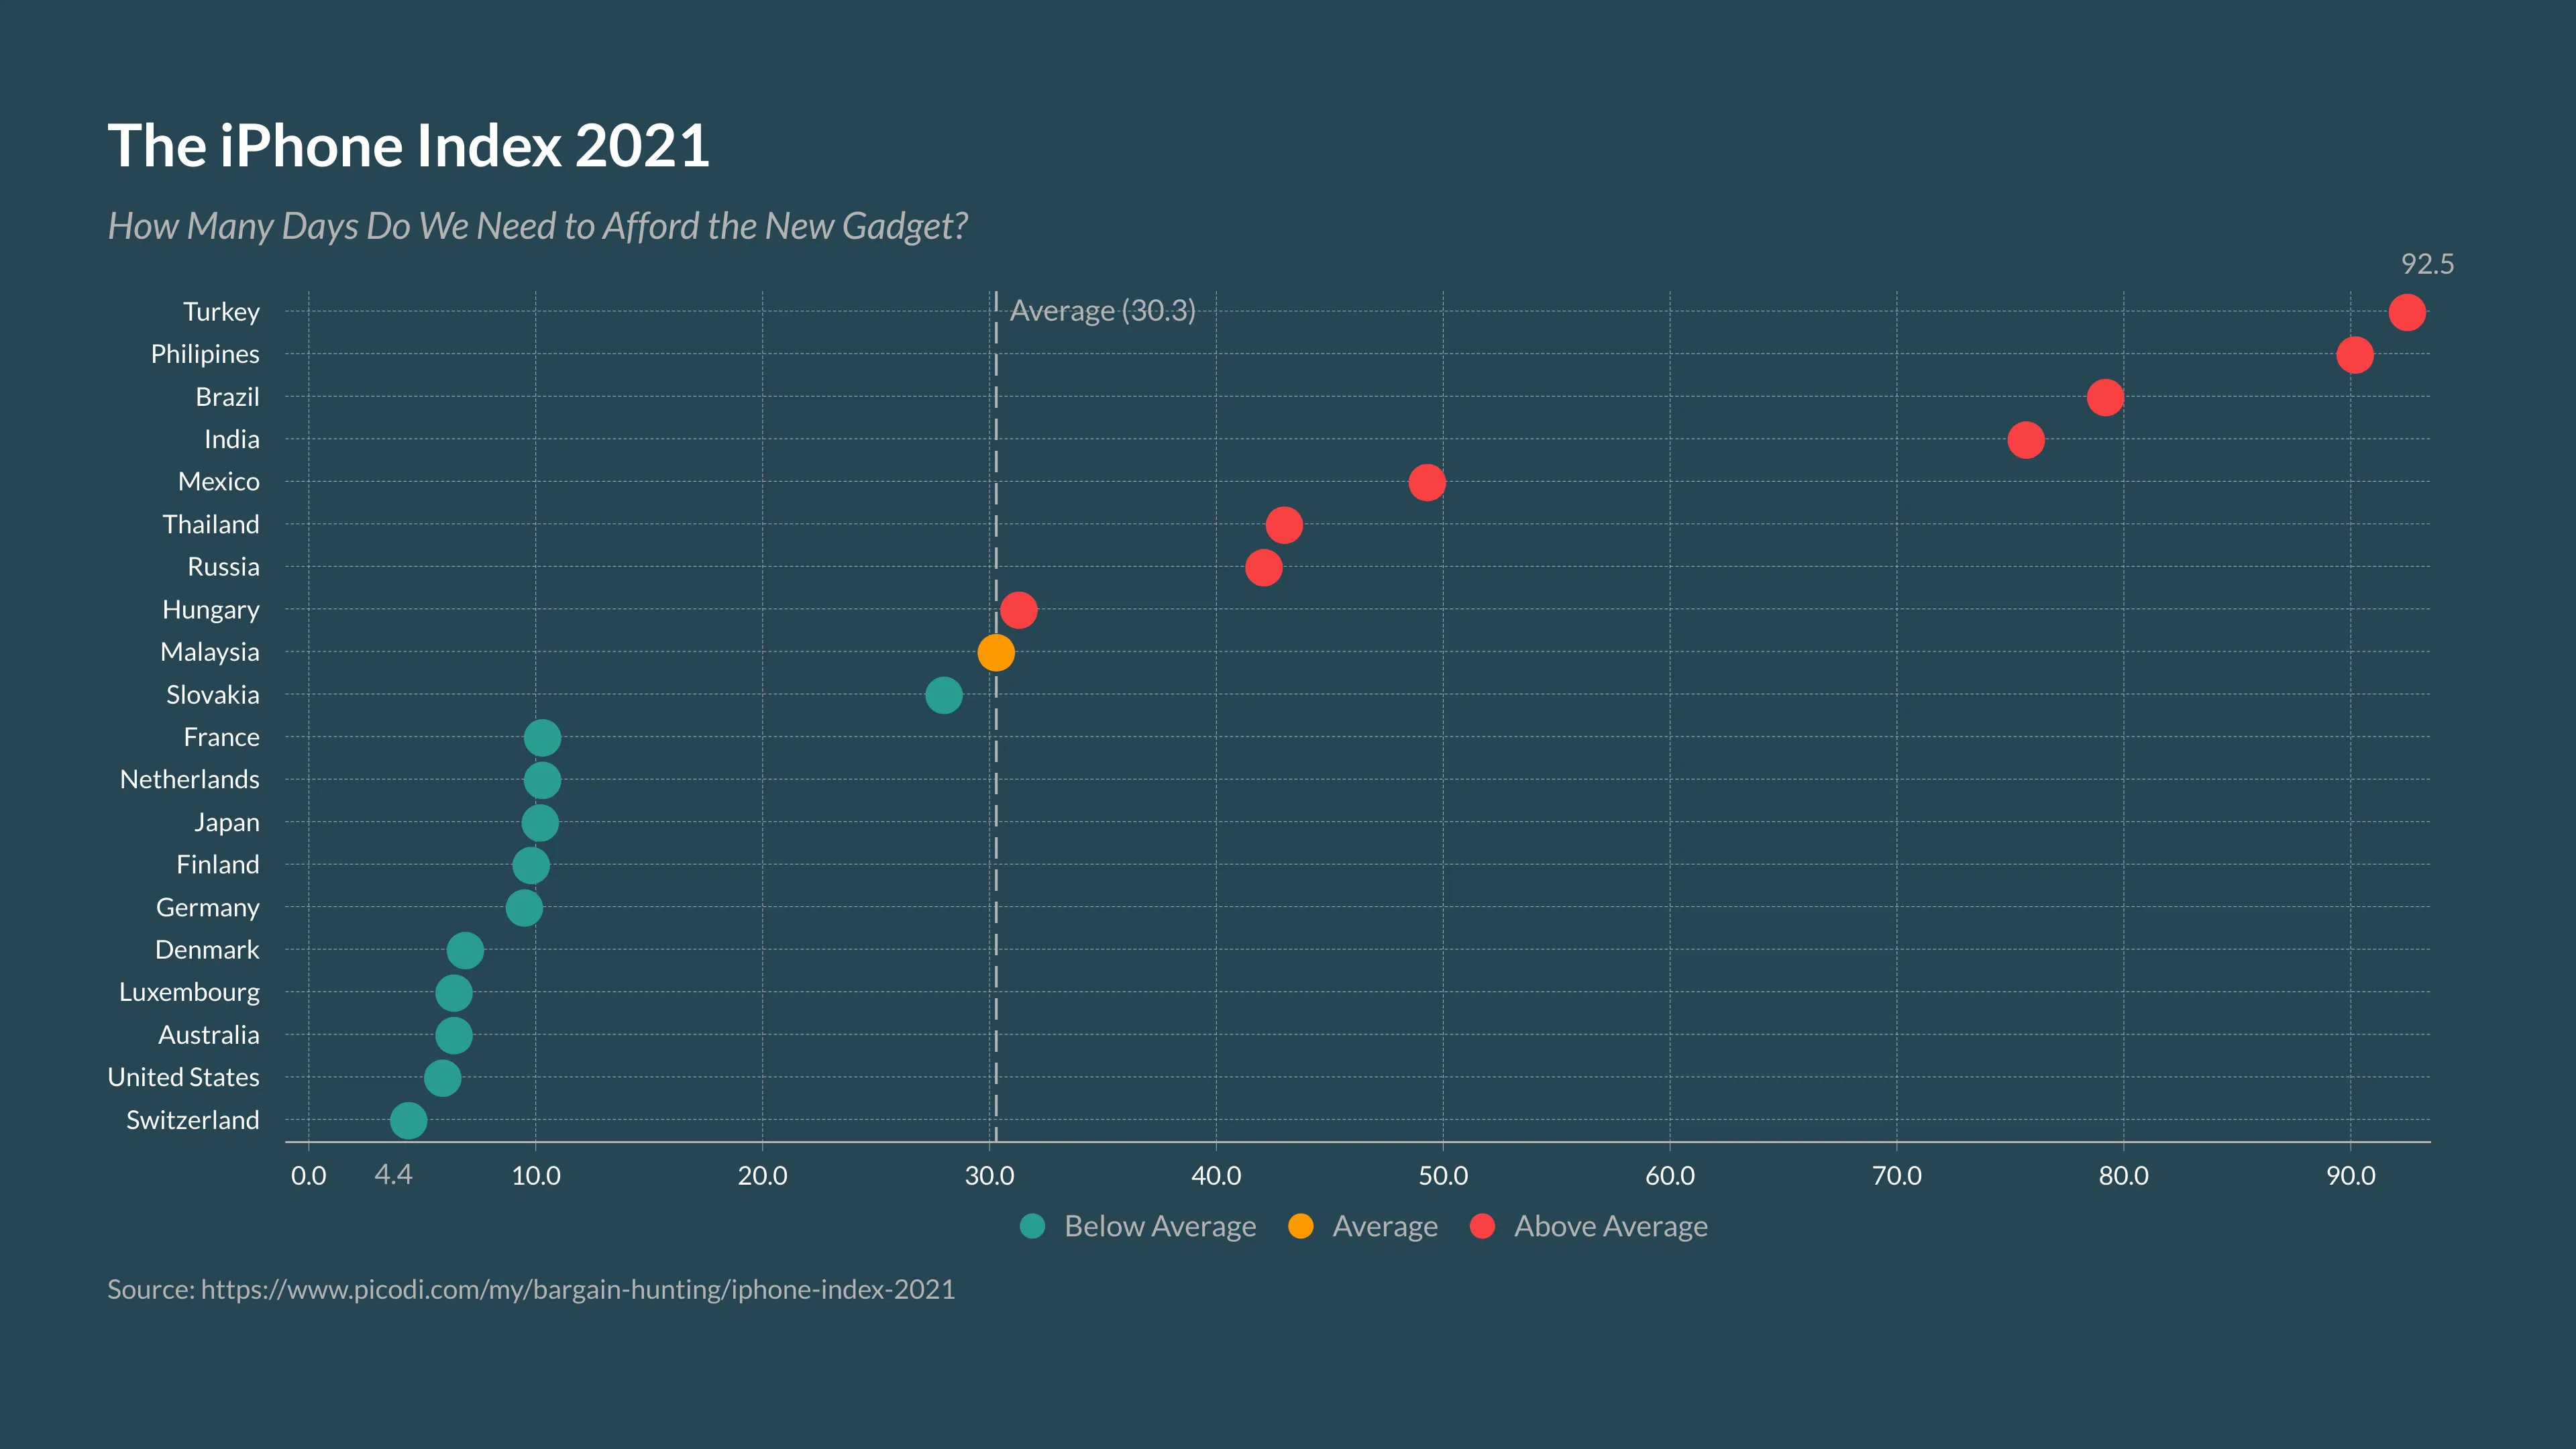
How many days do you need to work to afford the newest iPhone? This is what this chart shows, based on monthly average salaries by country (Numbeo) and local iPhone 13 (Pro - 128Gb) prices.
Known for the strong currency and high living standards, the top 5 list is comprised by Switzerland, where the average person needs to work only 4.4 days to afford the new Apple device, the United States (5.9 days), Australia (6.4), Luxembourg (6.4), and Denmark (6.9).
On the other extreme, the countries where workers need to work longer to be able to grab the new iPhone have seen their currencies suffer a strong devaluation recently and are also known for the high taxation on imports and income inequality. Turkey leads the way: the average turkish needs to work 92.5 days to get the new smartphone, followed by the Philipines (90.2 days), Brazil (79.2), India (75.7), and Mexico (49.3).
Source: https://www.picodi.com/my/bargain-hunting/iphone-index-2021
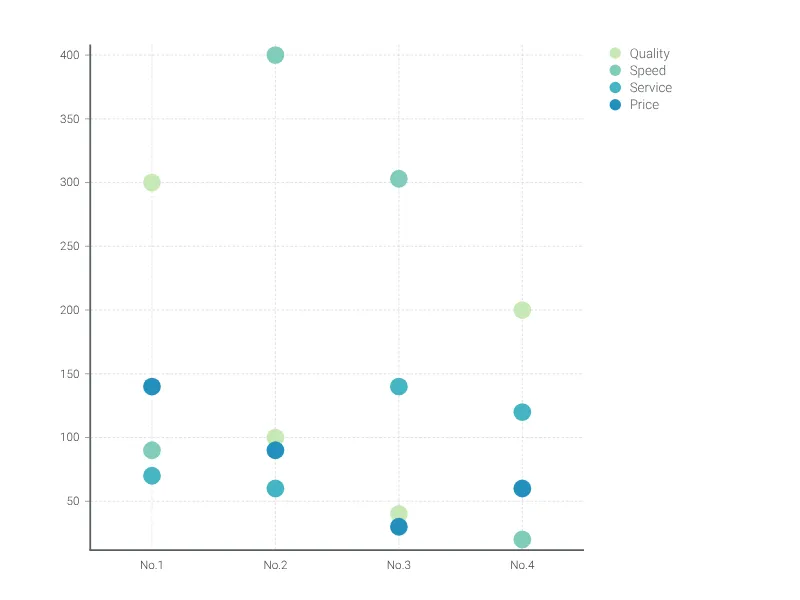
Dies ist ein Beispiel für Vizzlos "Punktdiagramm"
Das Punktdiagramm ist eine visuell ansprechende Alternative zum Balkendiagramm für einzelne oder mehrere Datenkategorien.