Chart Vizzard
Vizzlos KI-basierter Diagramm-GeneratorIndividual timetable for the conversion of L gas appliances to H gas
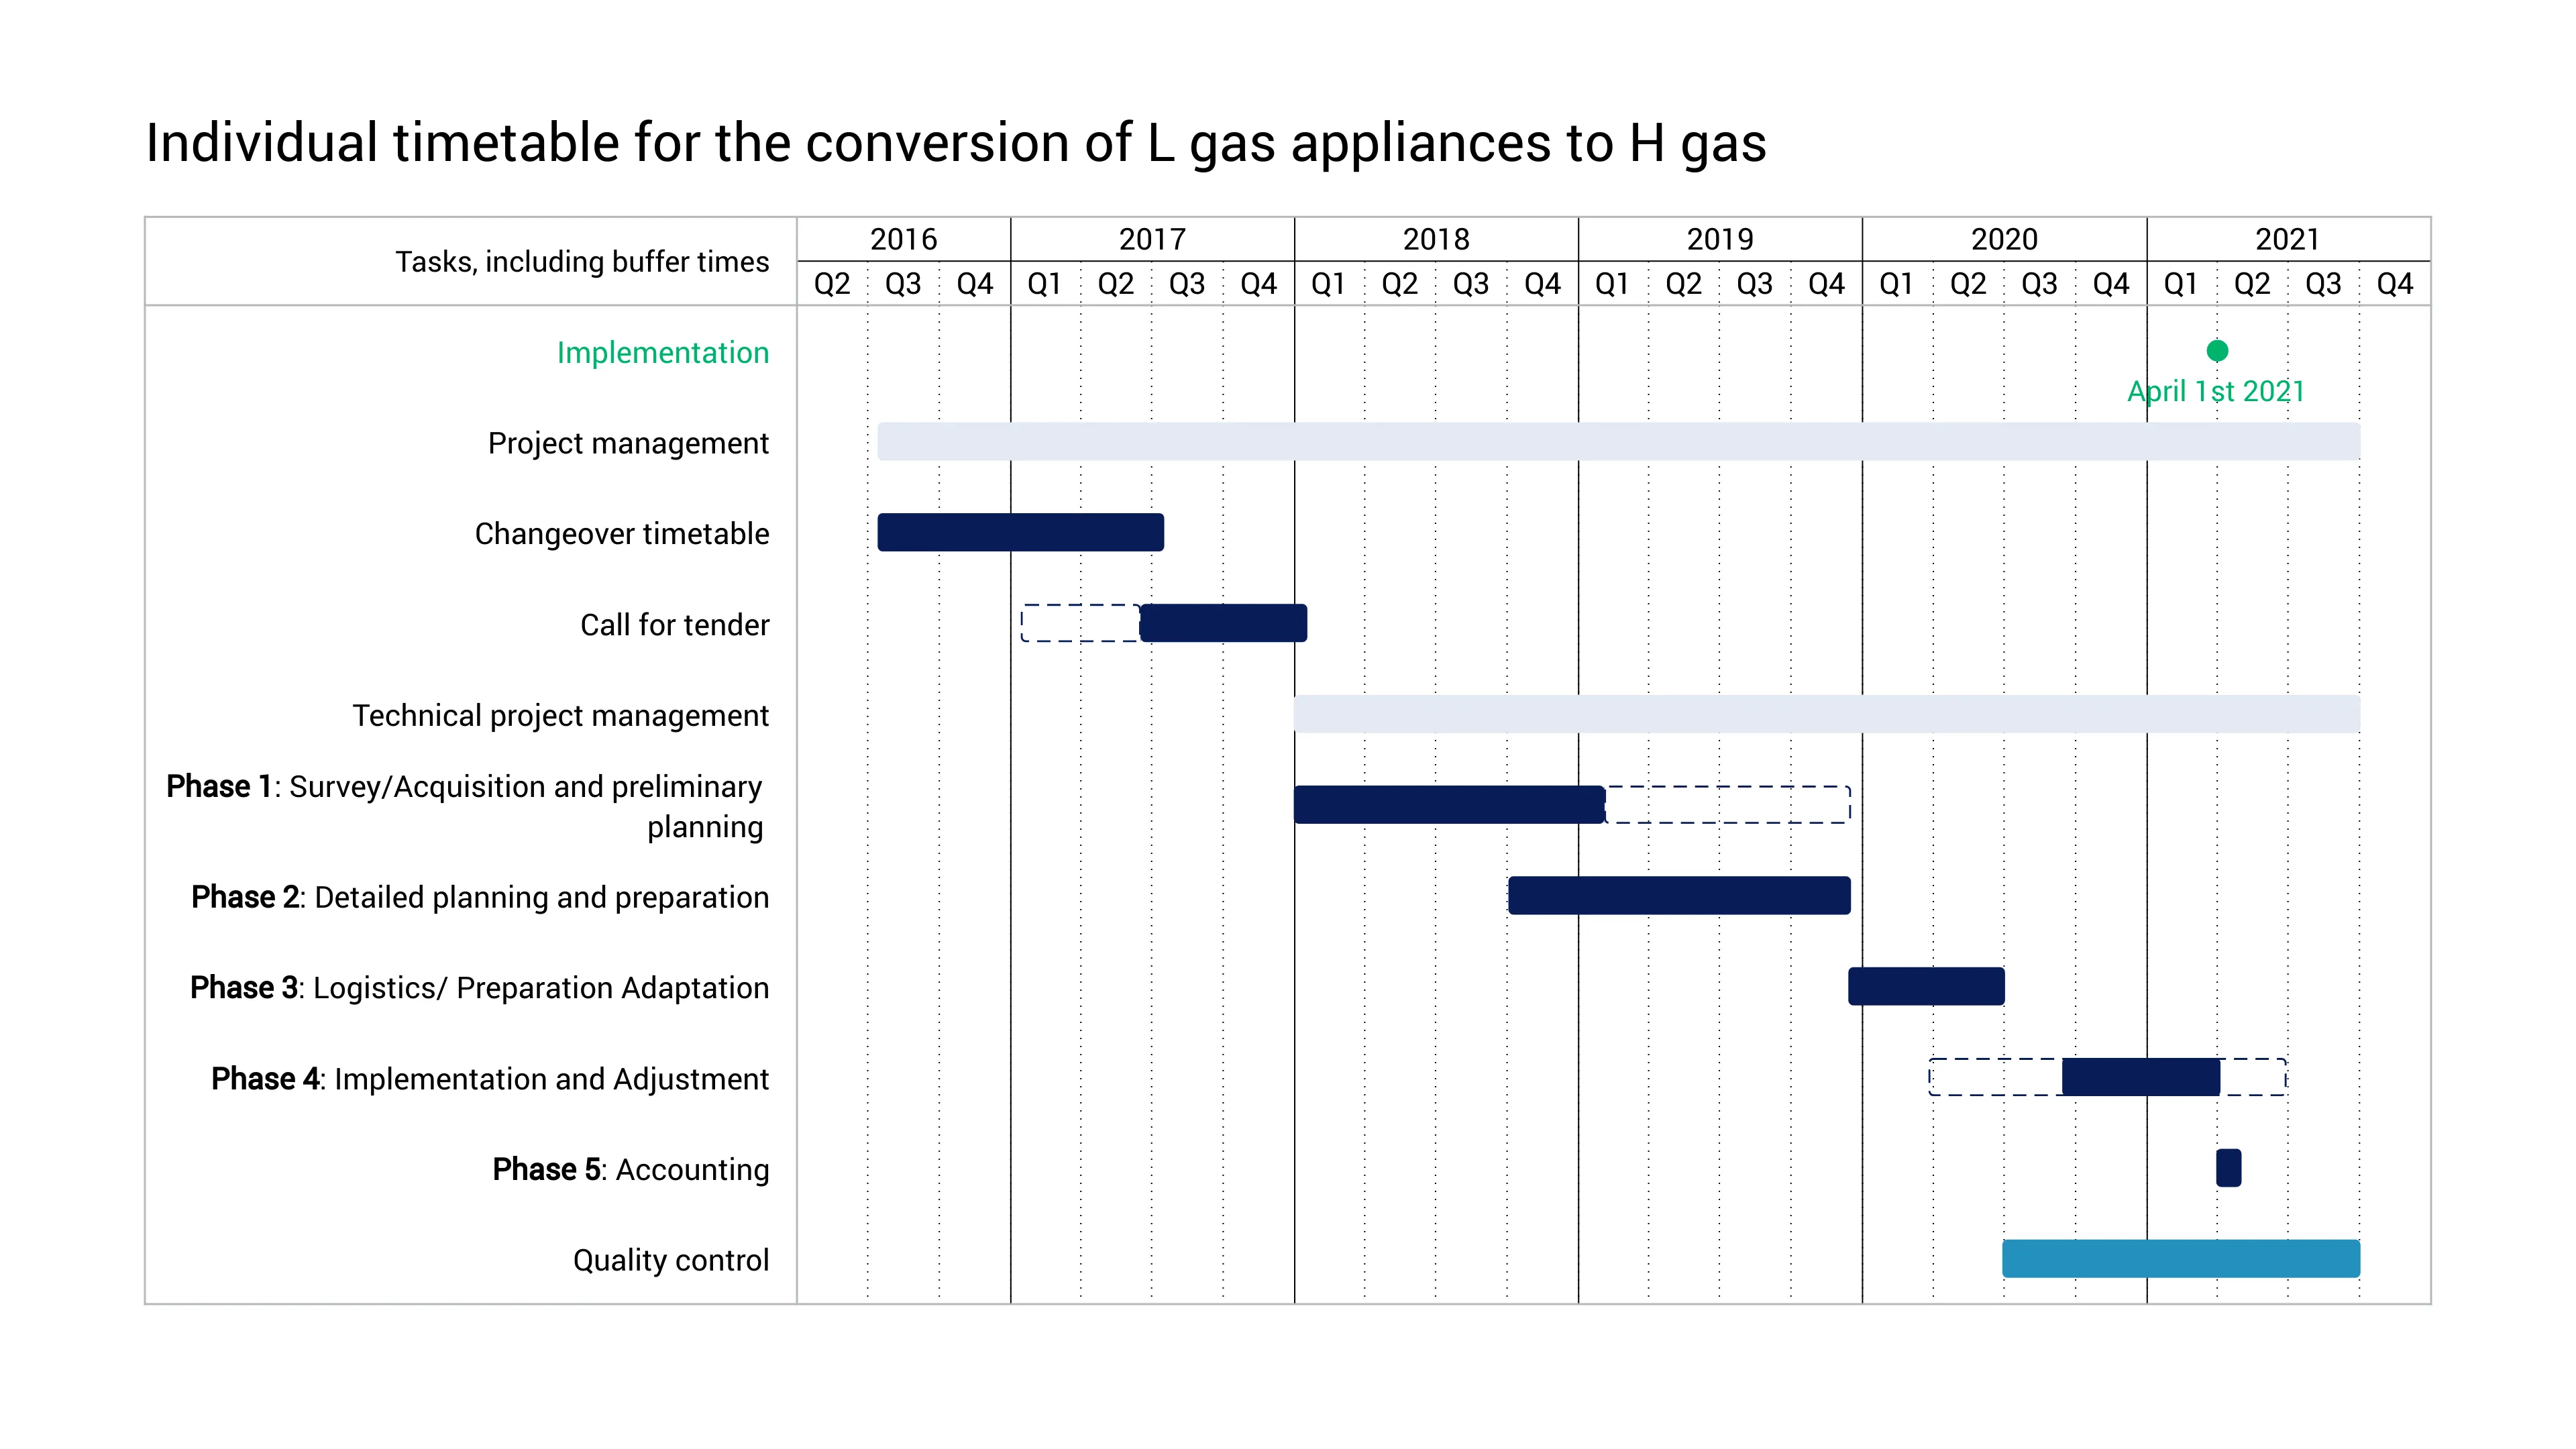
The conversion of the German L-gas area to H-gas is one of the biggest challenges for securing the long-term gas supply in Germany.
This is due to the significant decrease in domestic production of L-gas in combination with the also decreasing L-gas import volumes from the Netherlands. In order to take account of the decline in L-gas in terms of infrastructure, it is planned to convert the areas currently supplied with L-gas to H-gas.
For an industrial customer we have schematically outlined the phases of the changeover.
Dies ist ein Beispiel für Vizzlos "Gantt-Diagramm"
Visualisieren Sie Projektzeitpläne und Ihren Fortschritt.
Projektmanagement Zeitbasierte Diagramme Meilenstein-Diagramme Fortschrittsdiagramme Zeitpläne Zeitleisten & Roadmaps