Chart Vizzard
Vizzlo's AI-based chart generatorCreate your Gantt Chart in seconds
Our free Gantt software helps you create beautiful project management charts in no time. Online, in PowerPoint, or Google Slides.
Create your chart in 3 simple steps
- Create new Gantt Chart
- Add your data
- Export or share
Why Vizzlo?
- Create professional charts in seconds
- Fully customizable, no design skills needed
- Create directly in PowerPoint & Google Slides
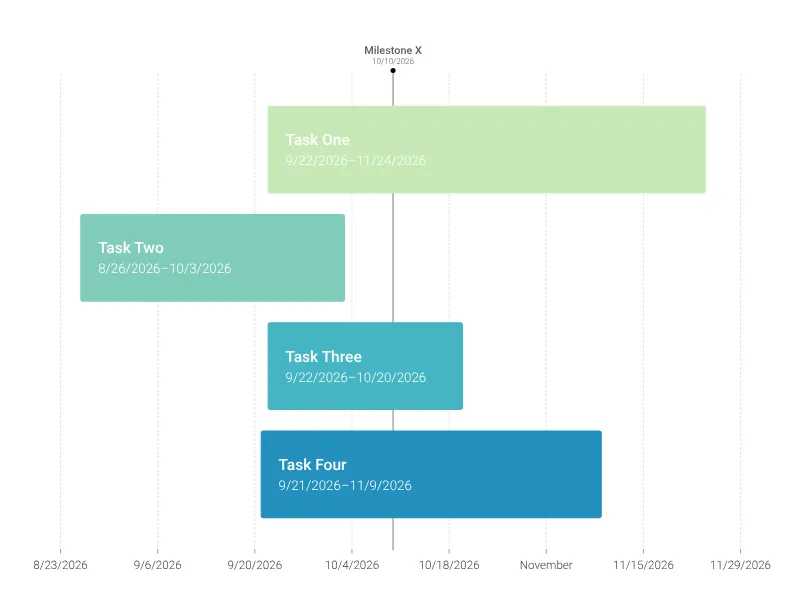
What is a Gantt chart?
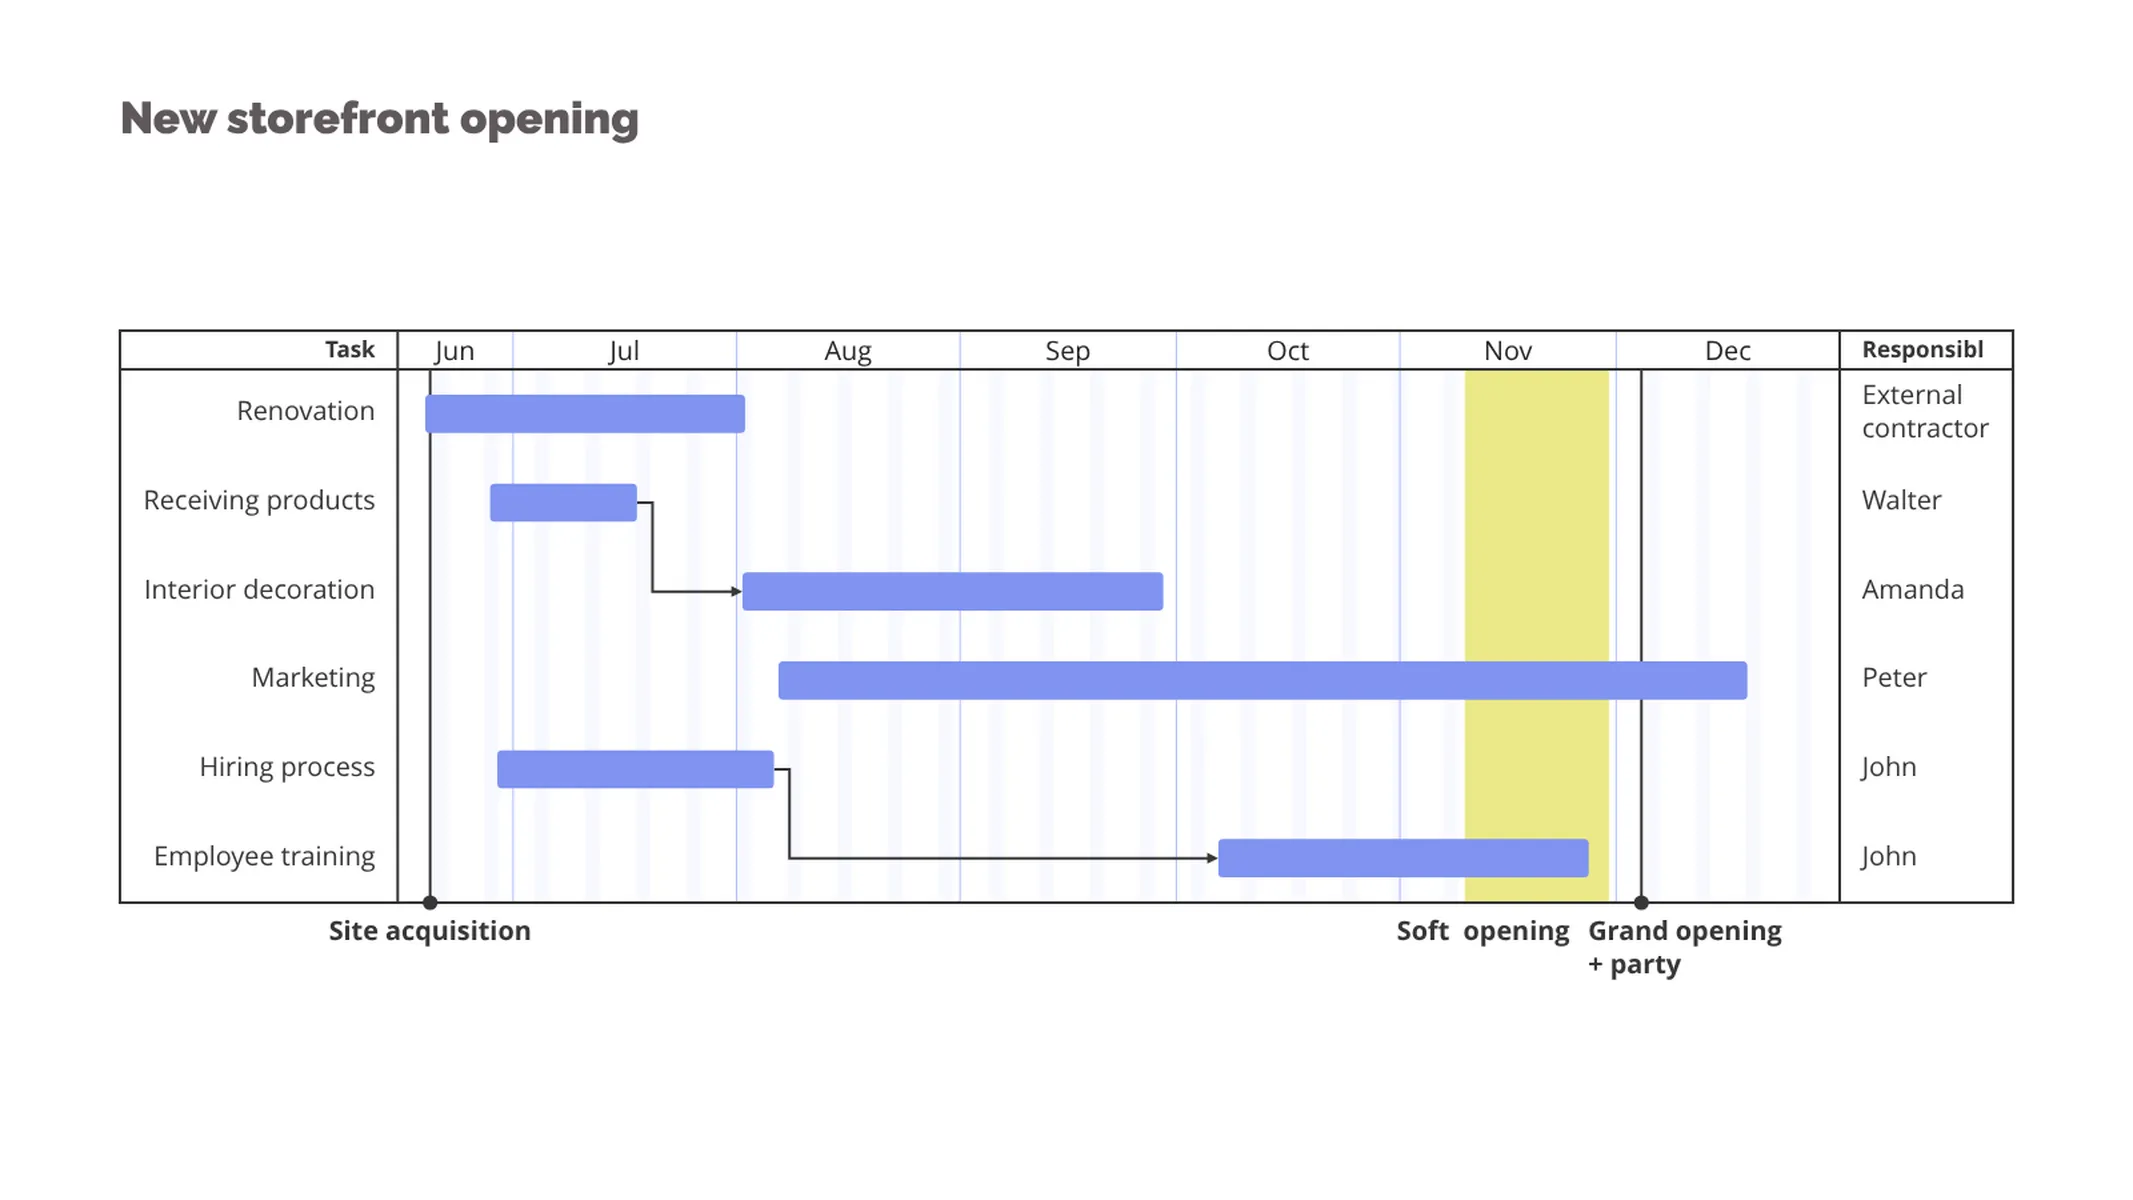
A Gantt chart is commonly used in project management. It requires knowledge, and skills on project activities to meet all requirements. When it comes to managing projects, you need tools to make them manageable. A Gantt chart is a timeline of your project. Professionals use Gantt charts to visualize how highly complex tasks can be broken down into smaller processes. It is one of the most popular and most effective ways to show a project’s timeline. A Gantt chart shows you what has to be done and when by whom. Tasks or events are displayed from top to bottom against time. Bars represent tasks as part of an activity. From the position and length of the bar, you can see the start date, duration, and end date of the task. The Gantt chart keeps the project team and informed from start to finish. To help you and your team collaborate efficiently. Vizzlo’s Gantt chart was designed to assist project managers and all other professionals in planning and communicating their work.
A brief history of the Gantt Chart
At the end of the 19th century, the Polish engineer and management researcher Karol Adamiecki aimed to enhance the visibility of production schedules. He invented a diagram to display interdependent processes, which he called ‘harmonogram’. Decades later, Henry Gantt designed his version of the diagram. He used the diagram, e.g., to provide a visual representation of the Hoover Dam Project, so that all parties involved could see when each phase of construction was scheduled. The chart became then widely known in Western countries under Gantt’s name.
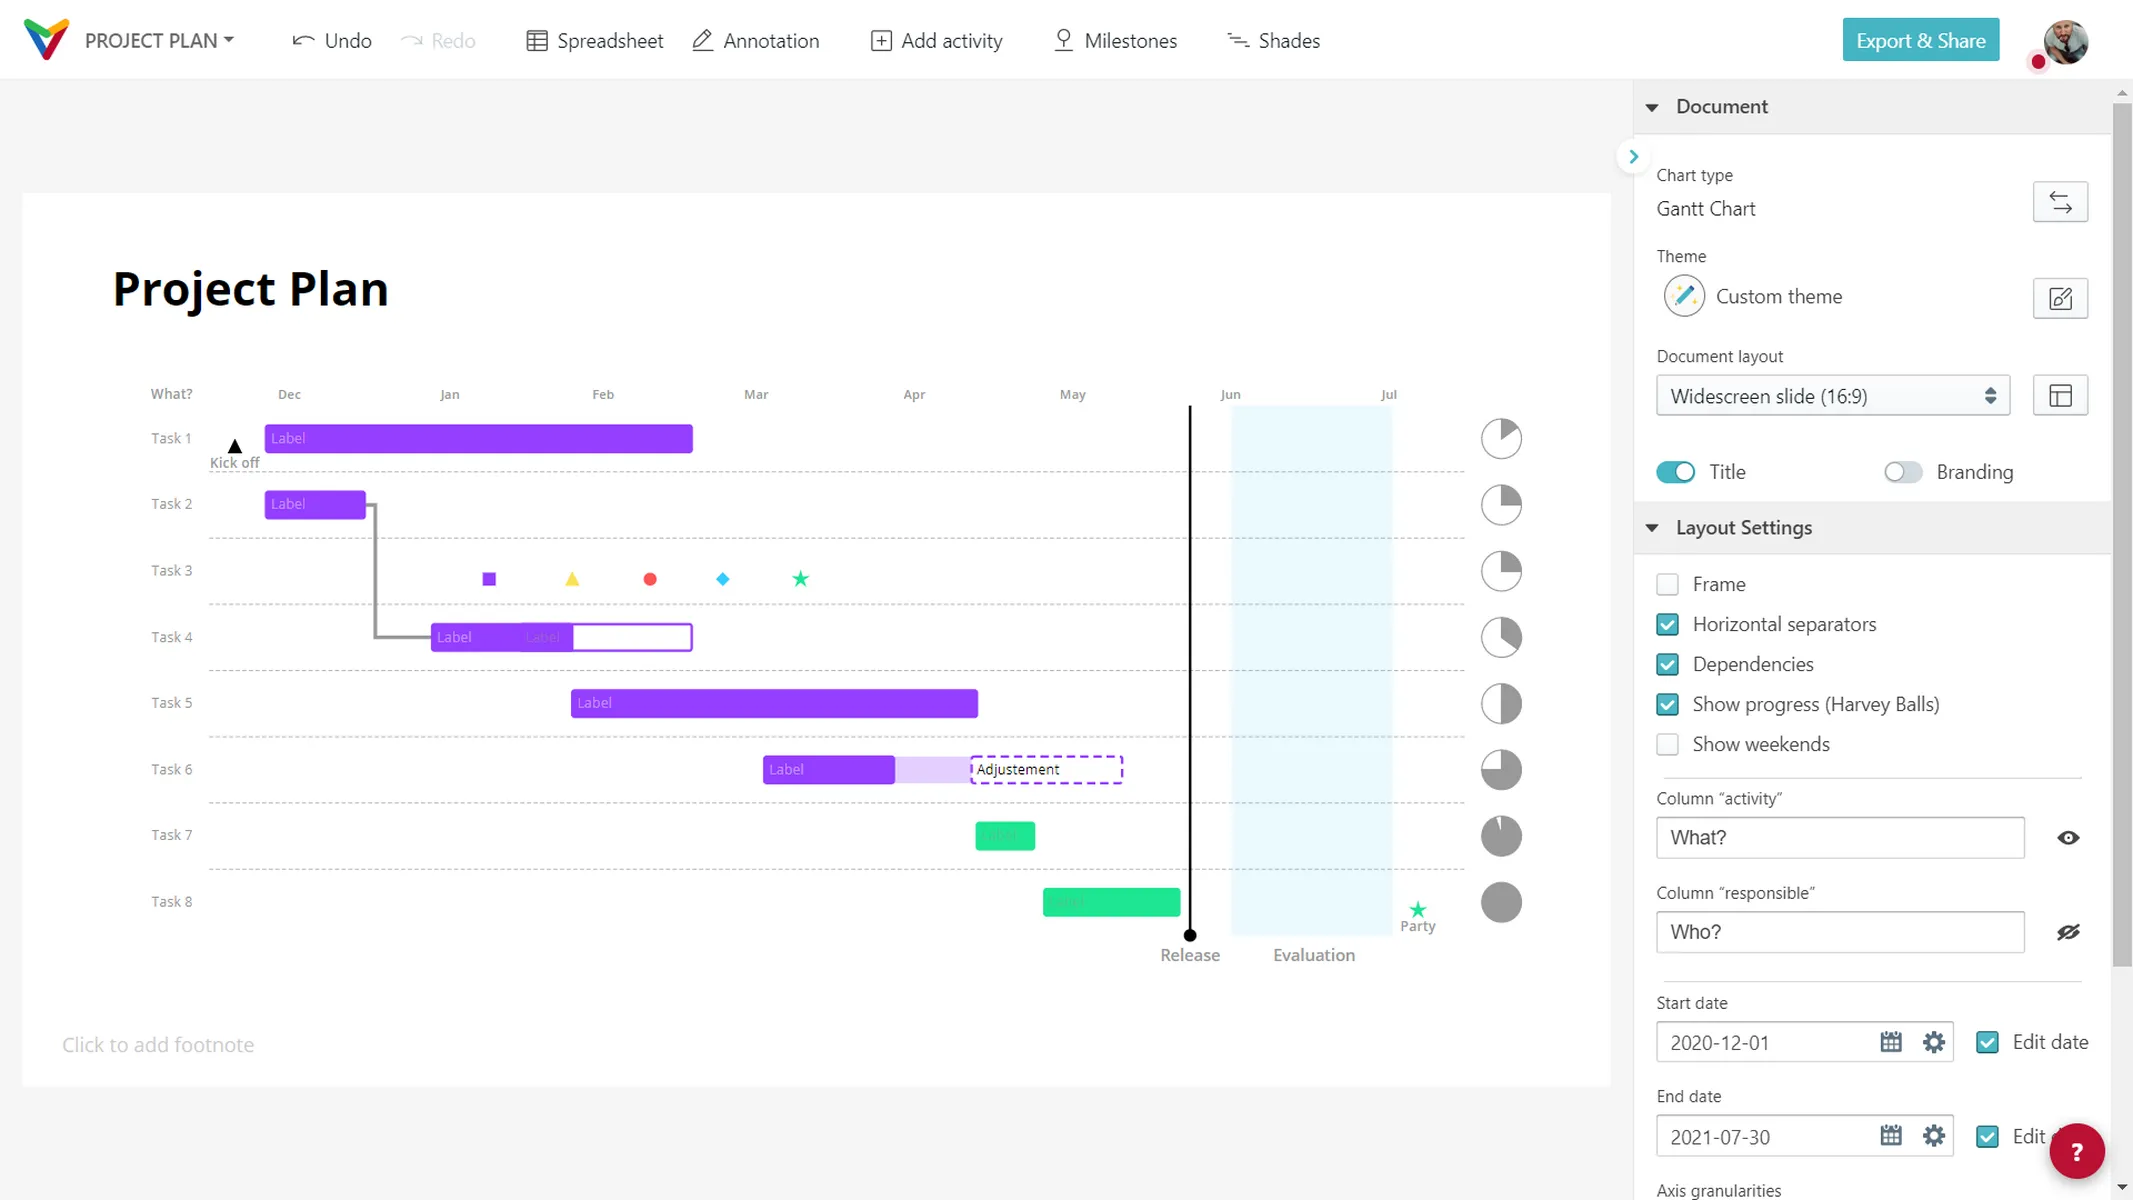
How to make a Gantt chart with Vizzlo
- Import data from MS Excel and other spreadsheet tools (CSV, XLS and XLSX), or
- Copy and paste your data into the chart’s spreadsheet.
- Move activities vertically to reposition them as needed.
- Adjust the start and end date of a task, milestones, or a shade using drag and drop.
- Insert new tasks, milestones with a single click.
- Add who’s responsible for each task in the project.
- Show the progress of your project.
- Adjust the width and date range of your Gantt chart.
- Explore the many customization options.
- Export your work as PDF or PNG.
- Embed the chart into PowerPoint or Google Slides.
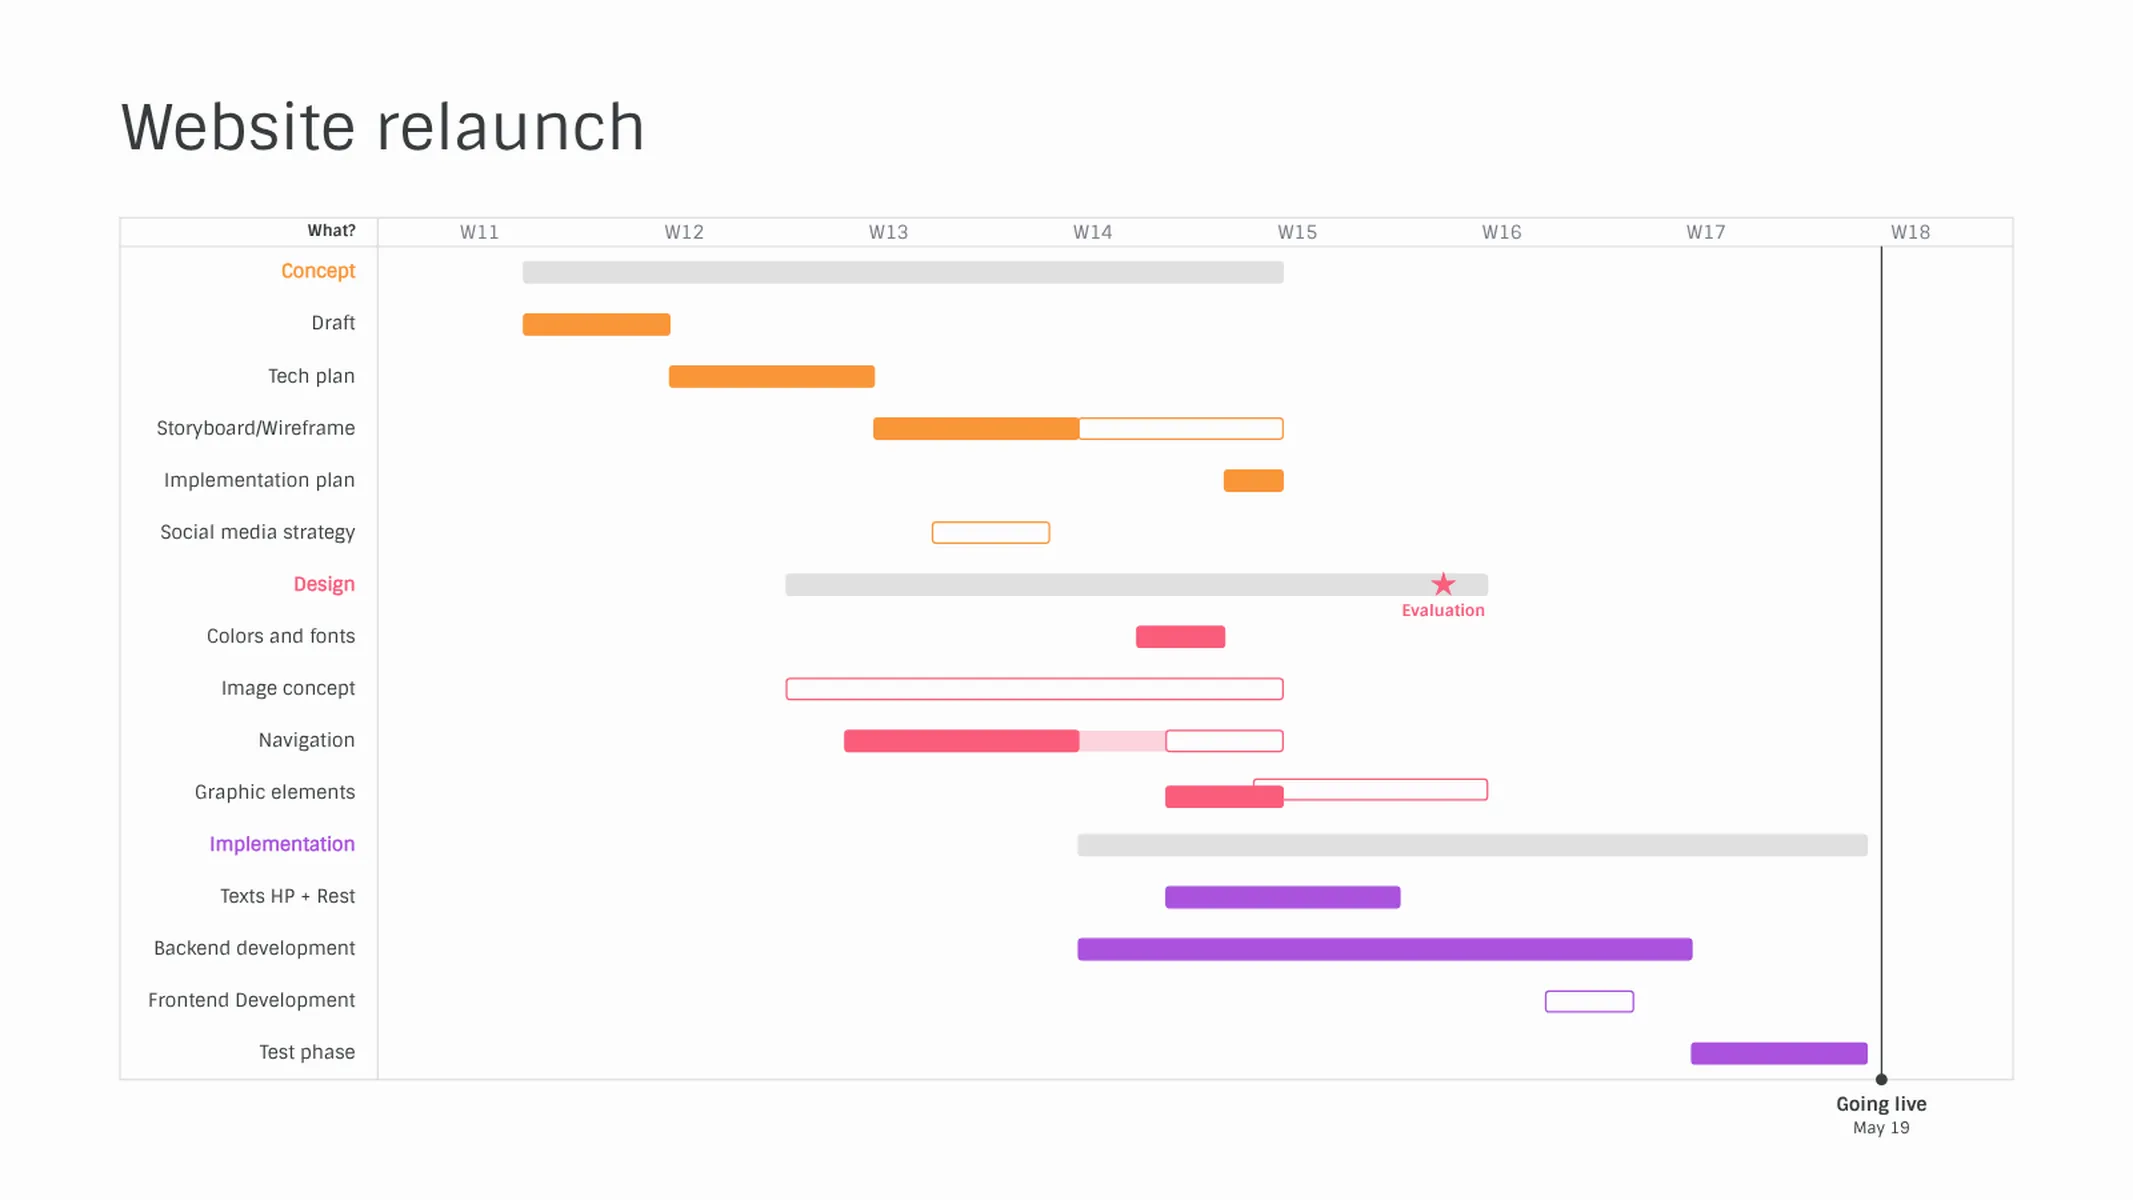
Gantt chart maker: key features
- The chart is fully interactive - simply click on any element and start editing!
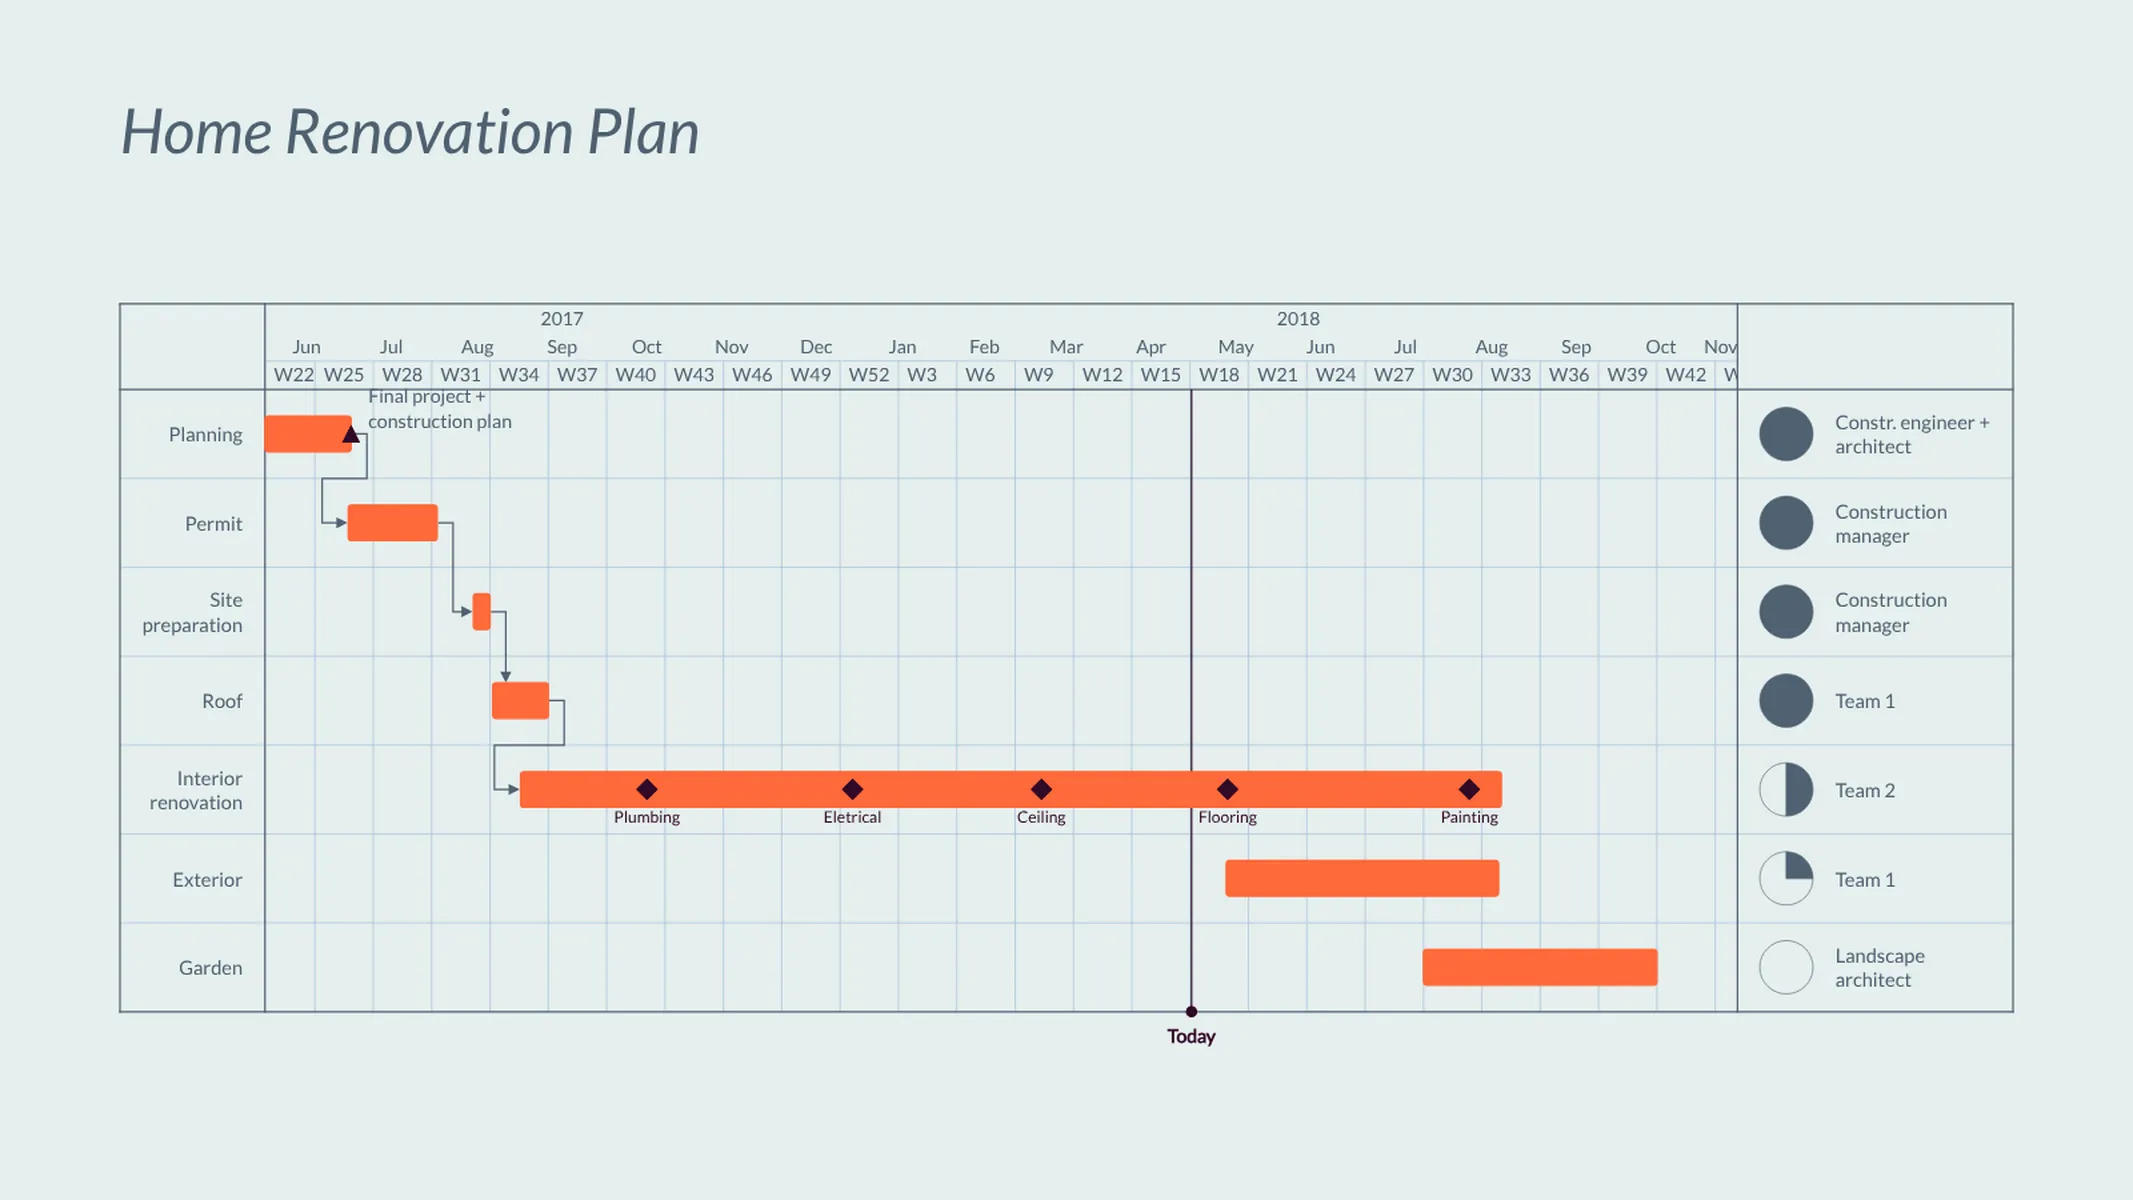
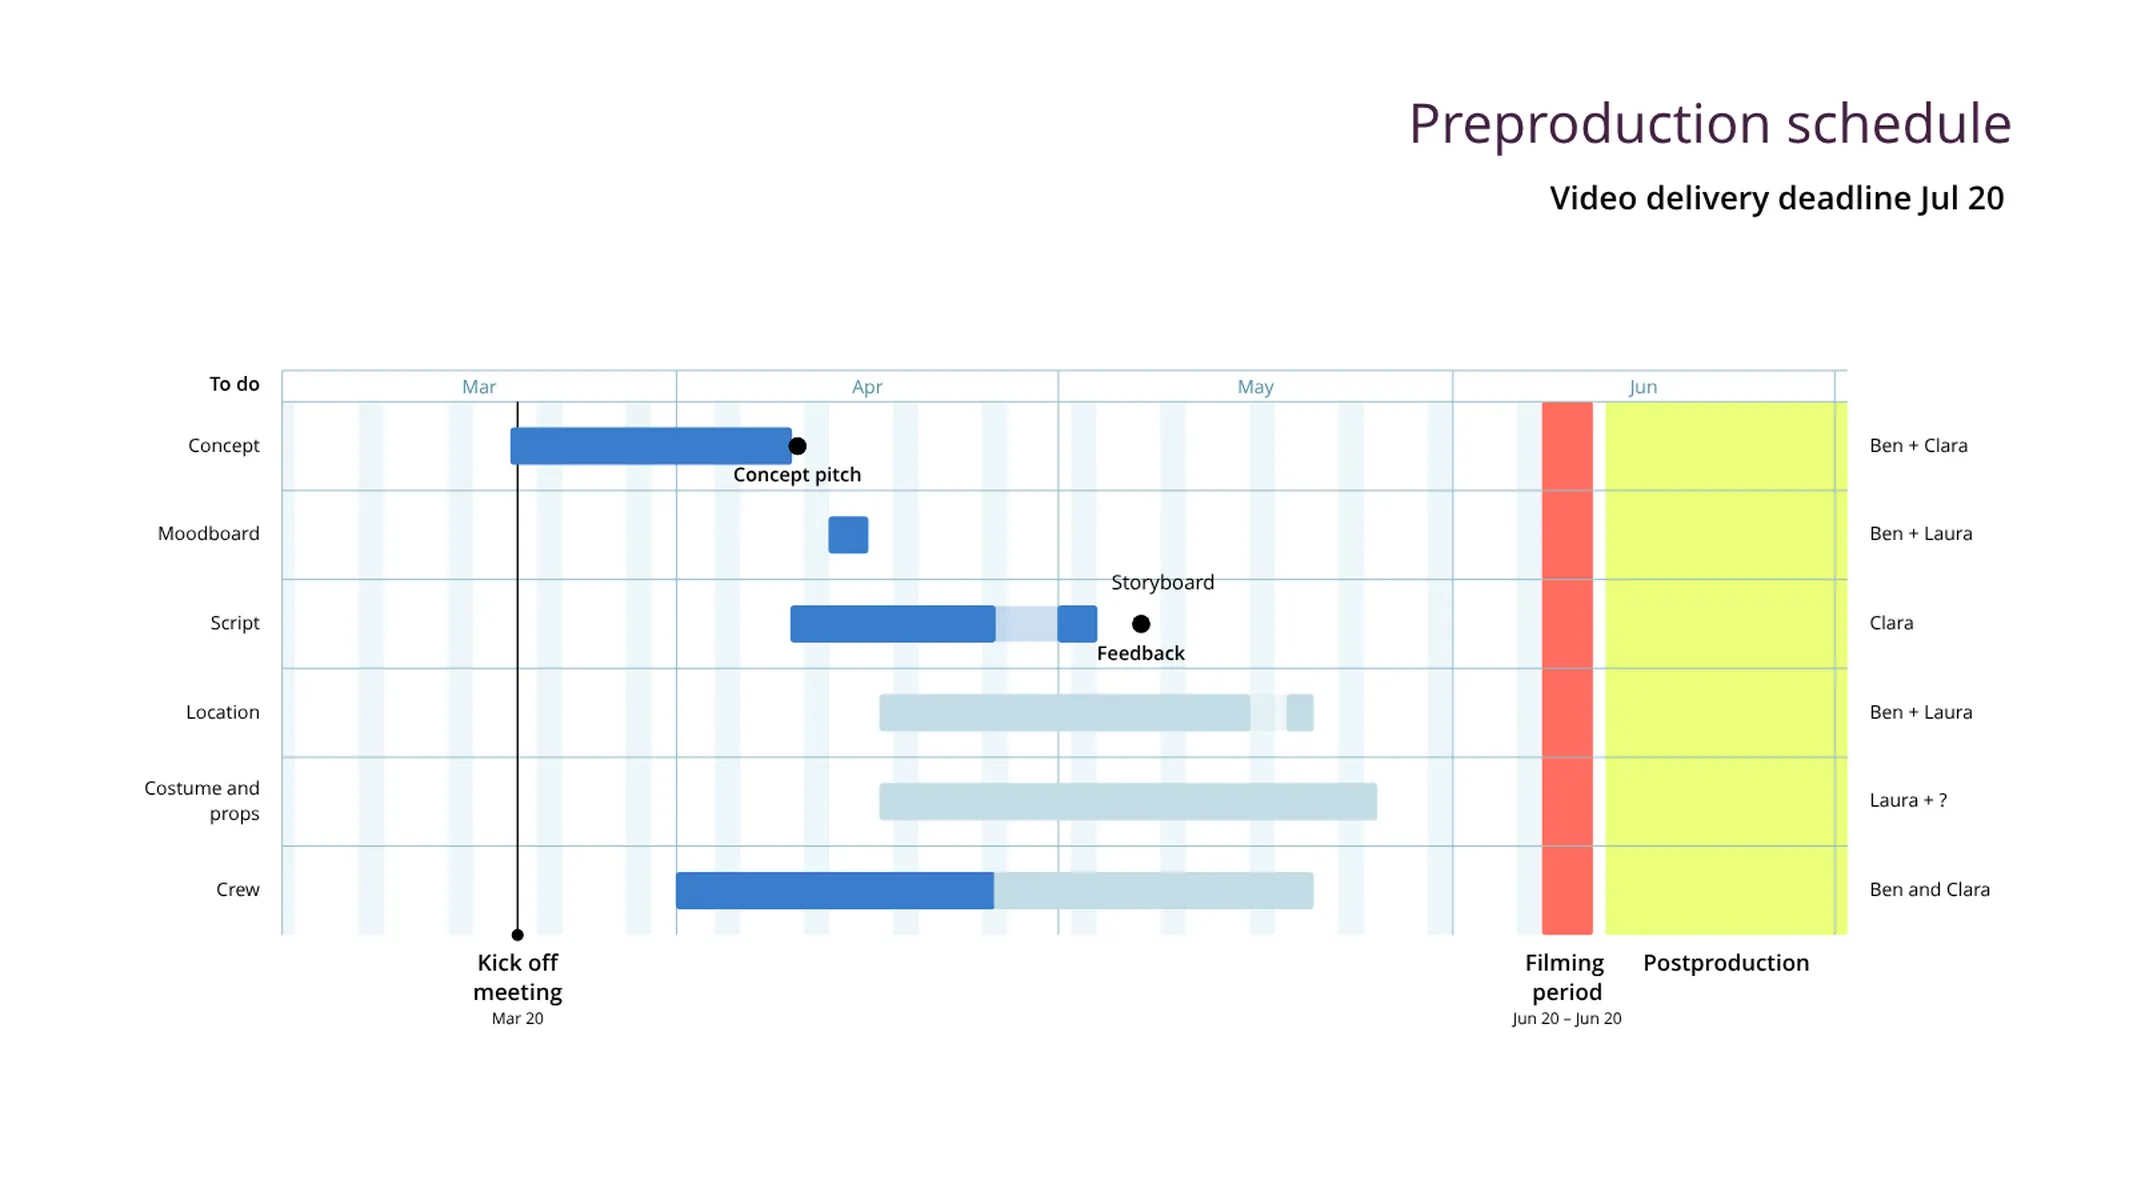
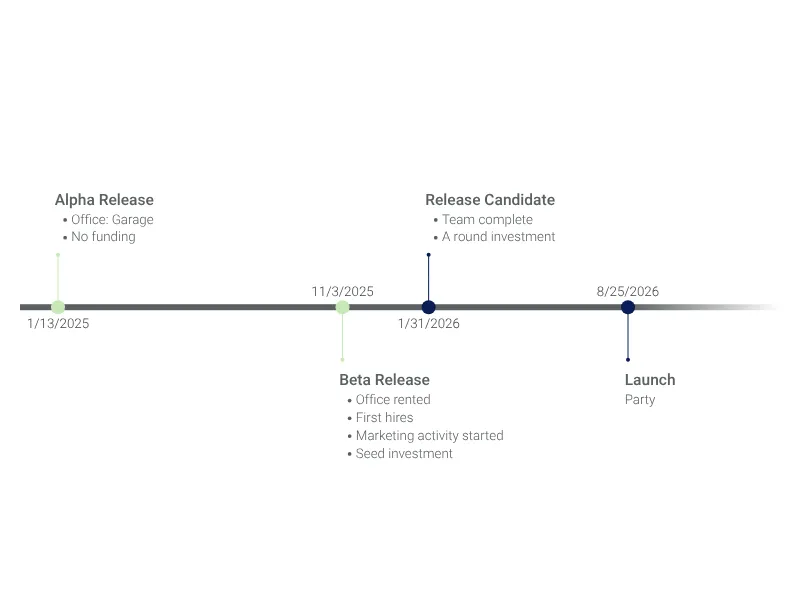
- Do you need to highlight single important dates along the project plan? Add further information to the chart! Use milestones in different colors and shapes.
- Add dependencies to highlight related and dependent tasks in a project.
- You can assign those different tasks to different members of a team so that everyone can work on their part of the project effectively.
- Use Harvey Balls to show the progress of each task, highlight weekends, and more.
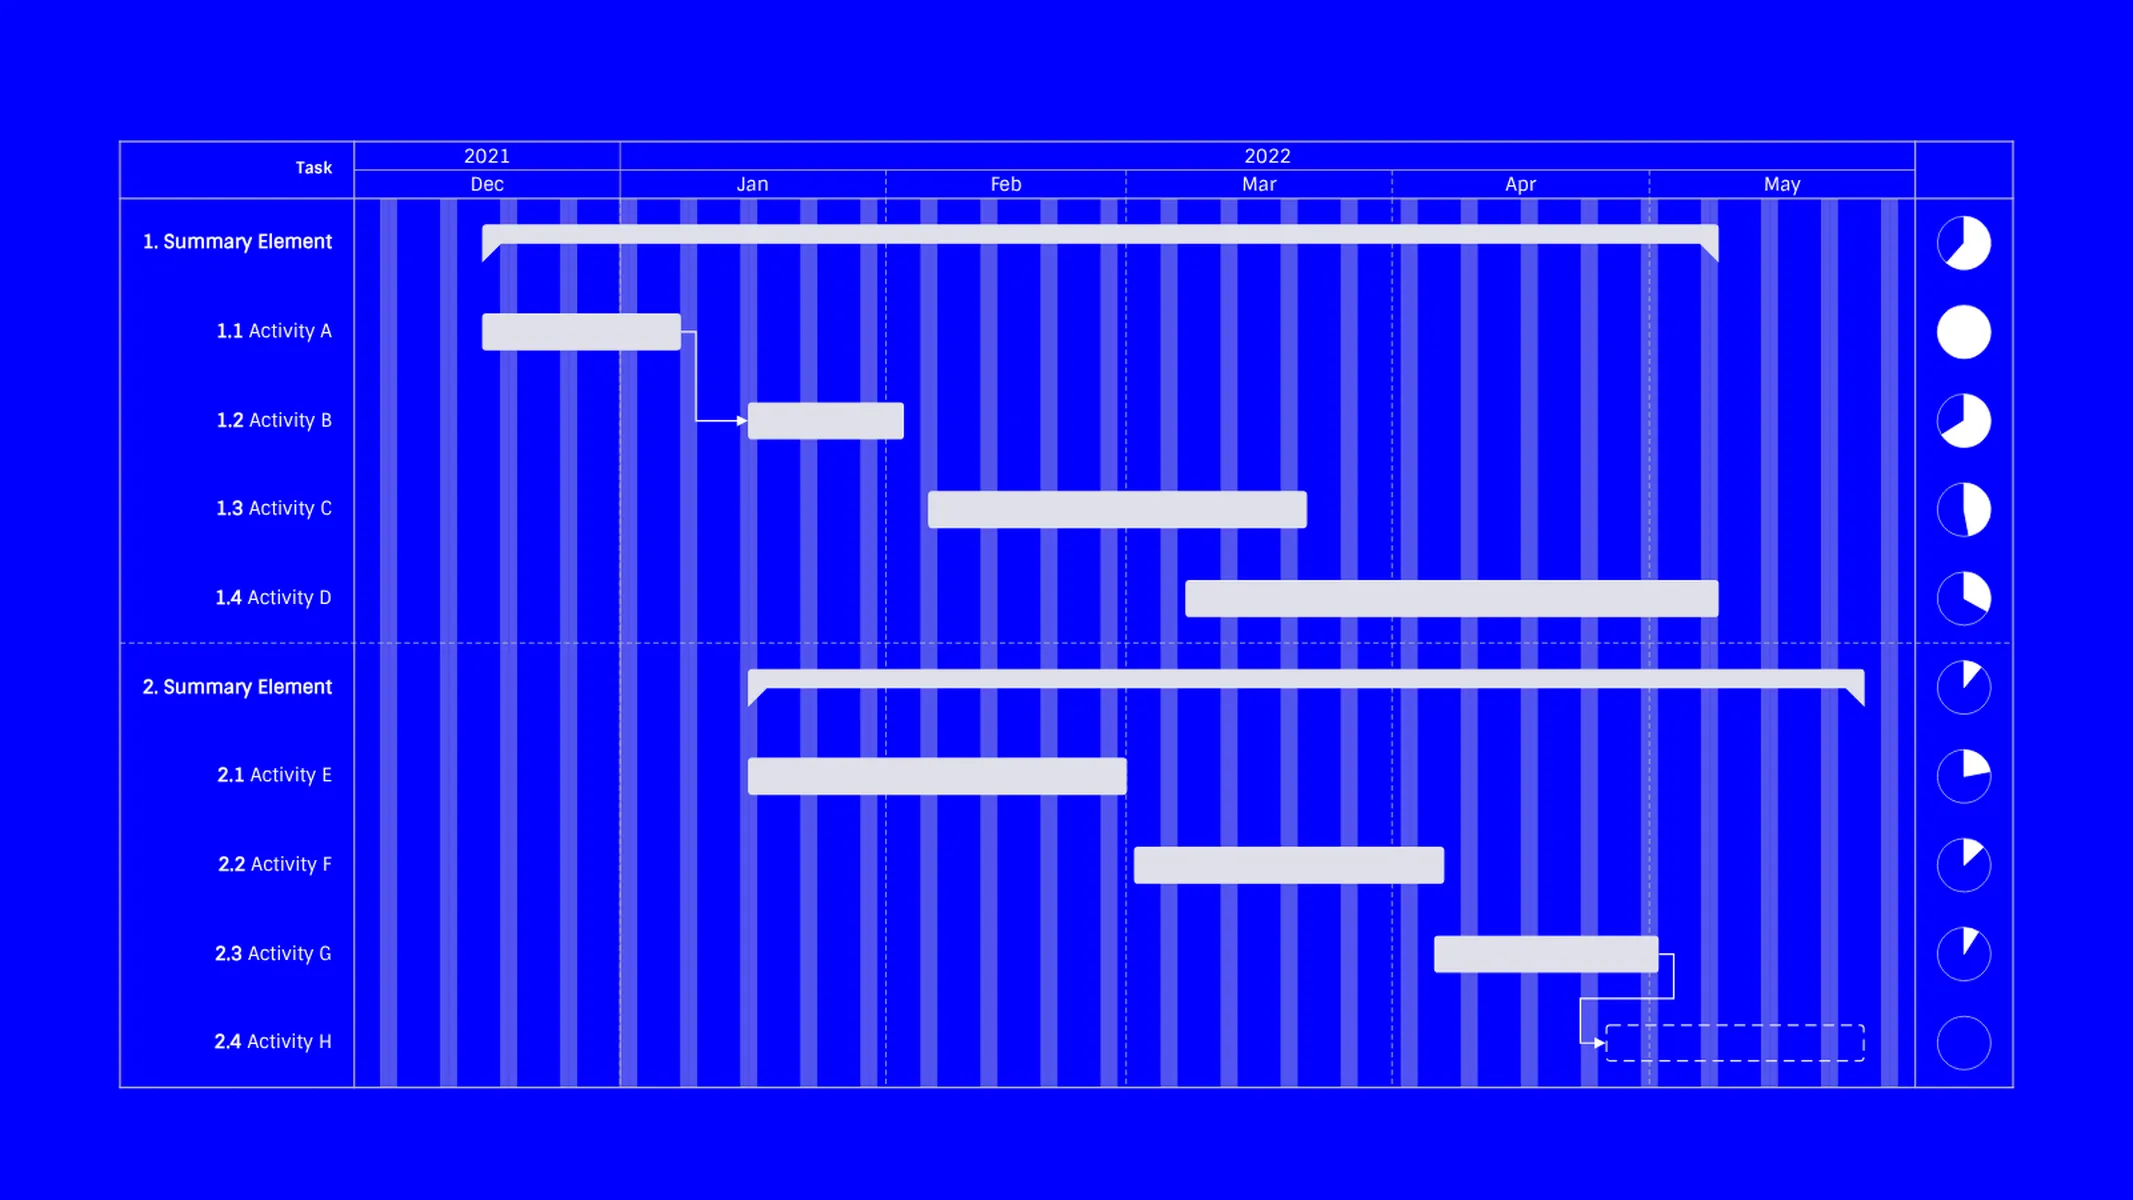
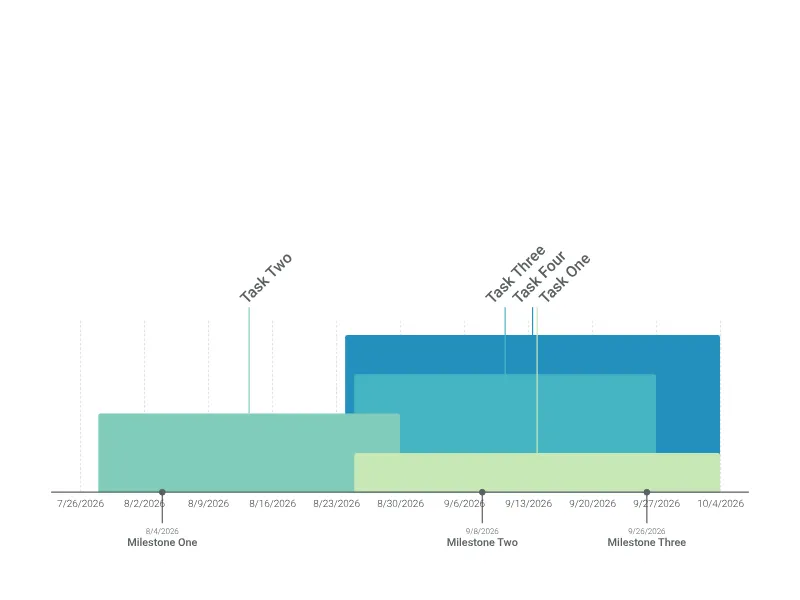
- With Vizzlo’s Gantt chart you can display up to three-time layers. Display guides and labels for days, weeks, months, quarters, or years.
- As opposed to tools like Microsoft Excel or Microsoft Project, using Vizzlo, it is possible to display multiple tasks for each activity. Each task can have its own label.
- Customize date formats of the horizontal axis and milestones independently.
- Choose different colors for each task and change their styles to solid, stroked or filled.
- Besides single days, you can also highlight weekends with one click.
Best uses for Gantt chart
- Project management
- Roadmap planning
- Team coordination
- Awareness of task dependency
- Process structure
- Timeline scheduling
- Achieving goals and meeting deadlines
Gantt chart: pro tips
- Use the same colors for tasks if you want to categorize them into groups.
- Set a milestone or add a shade to highlight important days or periods in your project timeline.
- Adjust the width of the vertical columns by drag and drop.
Resources
- Step-by-step tutorial
- What is a Gantt chart
- How to Create a Gantt Chart in PowerPoint With Vizzlo Templates
- How to make a Gantt chart using a Free Excel Template
Gantt Chart: What's new?
Fixed a Gantt chart issue where syncing could wrongly link elements or create duplicate element IDs.
Fixed data sync updates not working properly for predecessor columns.
When rescheduling, dependencies that are connecting segments to a milestone will place the milestone at the segment’s end date.
Fixed removing a dependency affecting the project date range in some cases.
Fixed dependency line style not being applied for connections in the same activity.
Spreadsheet editing is more stable now.
Fixed being unable to reposition activities in some cases.
Segment tooltip positioning improved for complex documents.
Gantt Chart Alternatives
Enhance your productivity
Create a Gantt Chart directly in the tools you love

Create a Gantt Chart in PowerPoint with
Vizzlo's add-in

Loved by professionals around the world


Visualizations your audience won’t forget
Convey abstract concepts and data with professionally designed
charts and graphics you can easily edit and customize.