VORSCHAU
Chart Vizzard
Vizzlos KI-basierter Diagramm-GeneratorHow often do Brits consume animal-free products?
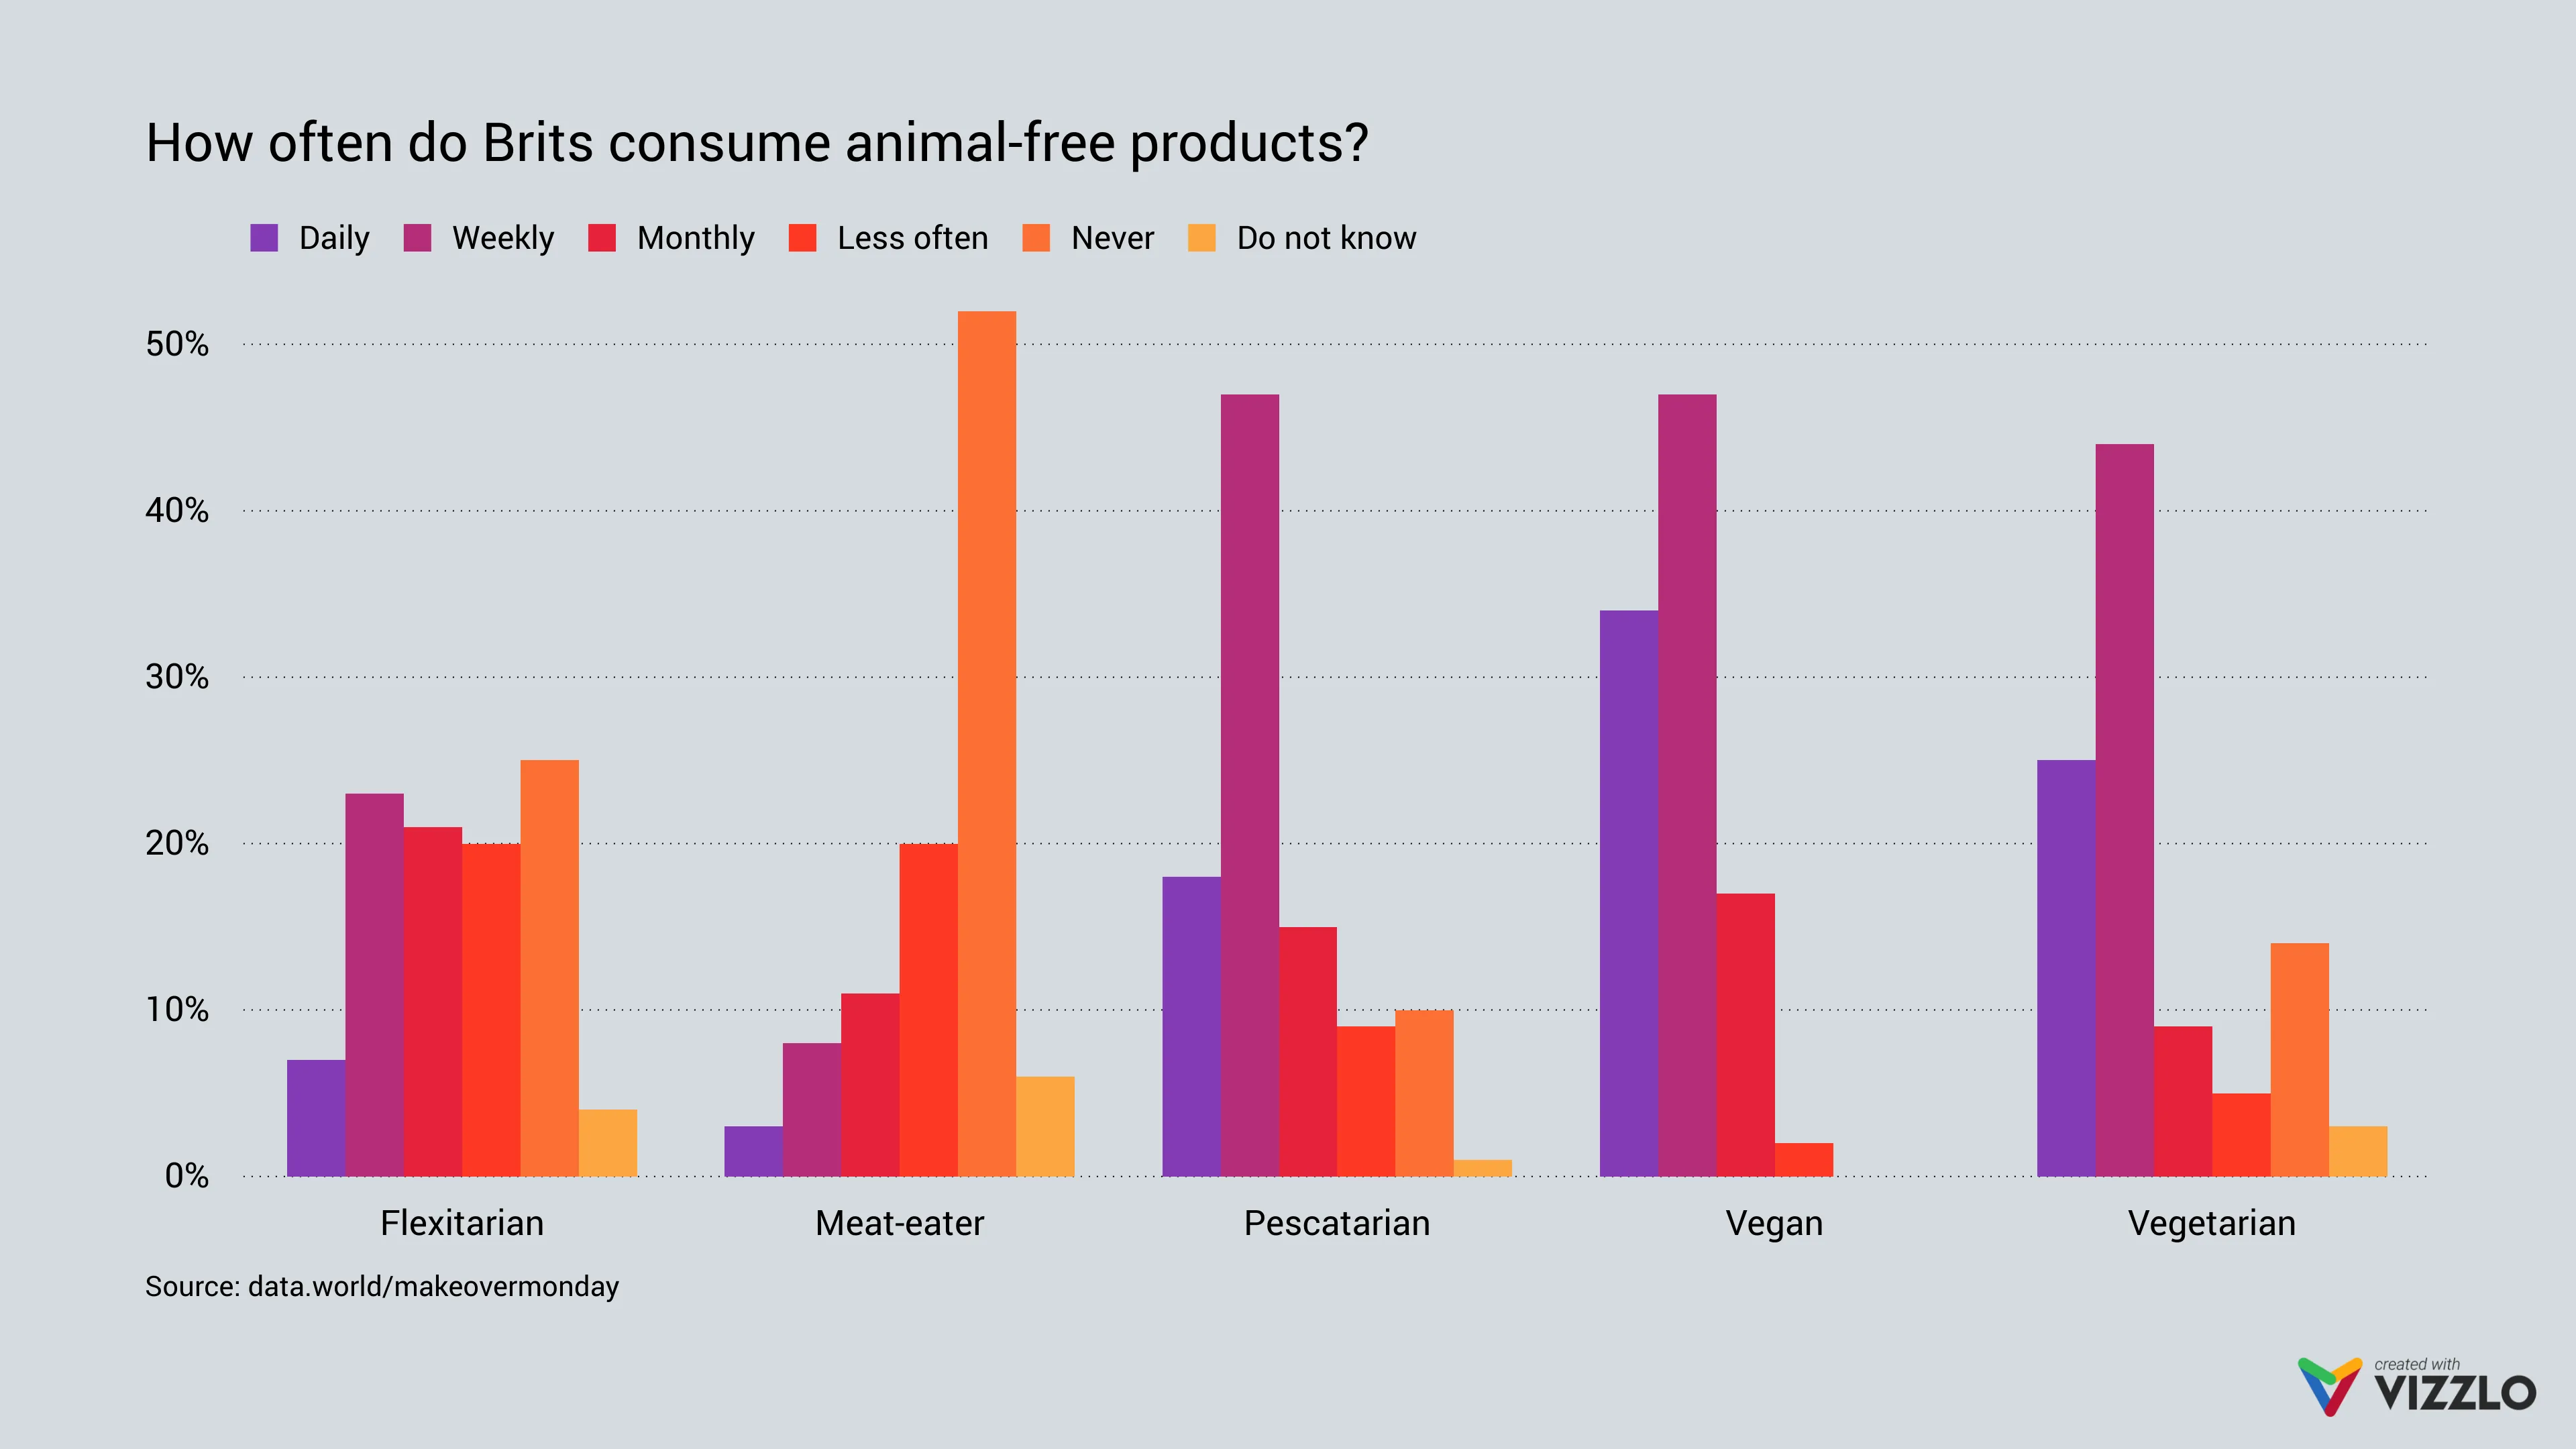
How frequently, if at all, do you consume specifically meat-free or animal-free products such as meat alternatives or dairy substitutes?
Vegans and vegetarians look set to make up a quarter of the British population in 2025, and flexitarians just under half of all UK consumers, the Sainsbury’s Future of Food Report says.
As of 2019, frequent consumption of meat-free and animal-free products was most likely to occur among vegans, vegetarians, and pescatarians.
Source: data.world
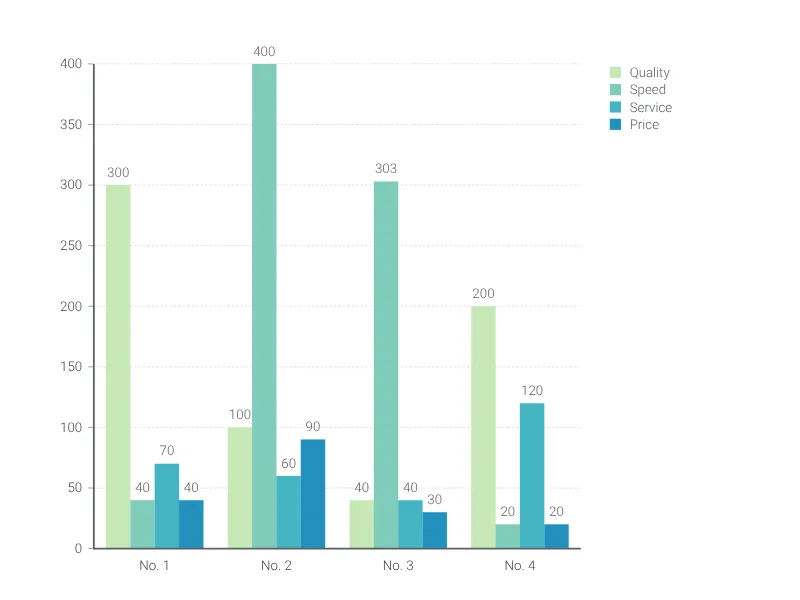
Dies ist ein Beispiel für Vizzlos "Gruppiertes Balkendiagramm"
Verwenden Sie ein gruppiertes Balkendiagramm, um gleiche Kategorien innerhalb verschiedener Gruppen zu vergleichen.
Finanzen & Wirtschaft Vertrieb & Marketing Balken- & Säulendiagramme