Chart Vizzard
Vizzlos KI-basierter Diagramm-GeneratorHow 2020 shaped streaming trends
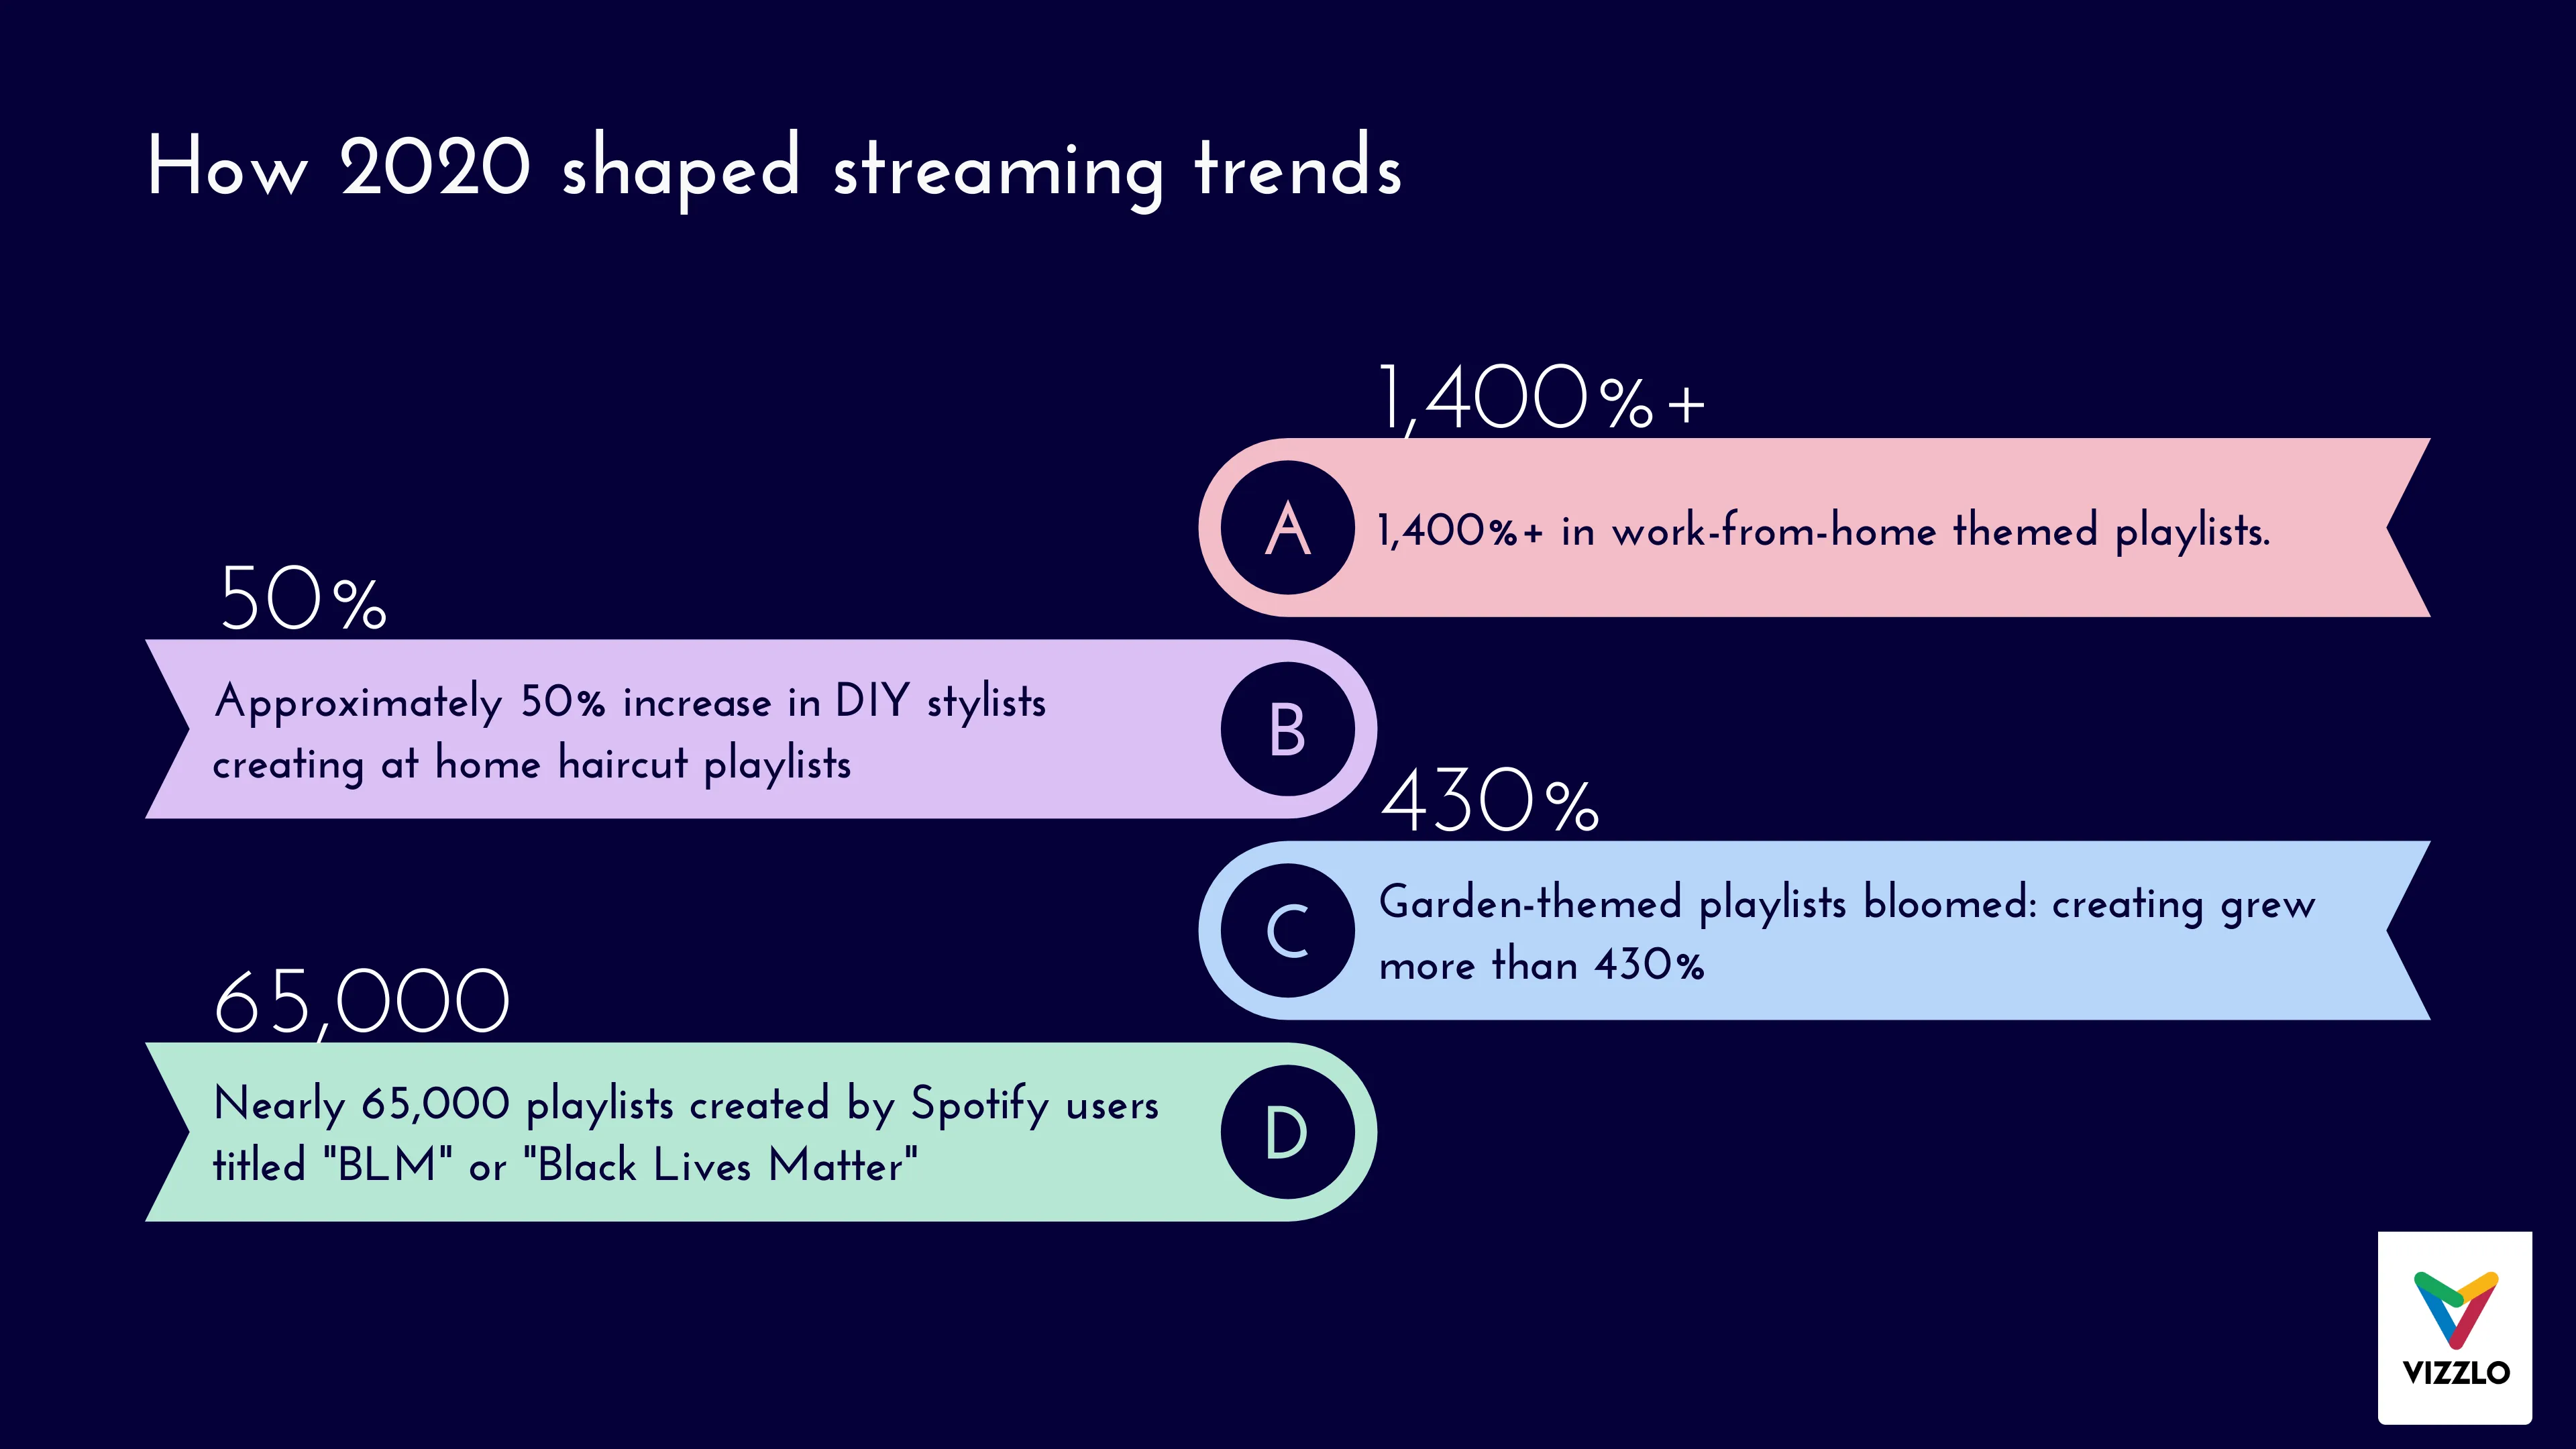
2020 was a year unlike any other - and it also sounded differently, according to Spotify’s trends that shaped streaming in 2020.
As people started to social distance, there was a strong increase in work-from-home-themed playlists (1,400%+). Also nostalgia-themed playlists and the number of listeners listening to wellness podcasts increased.
This was also a year that called for the amplification of Black voices across songs, playlists, and podcasts as people around the world took to the streets to say that #BlackLivesMatter.
Dies ist ein Beispiel für Vizzlos "Meilensteinliste"
Präsentieren Sie Ihre Projektmeilensteine auf einfache und überzeugende Weise mit dieser vertikalen Liste.
Projektmanagement Prozess- & Strukturdiagramme Meilenstein-Diagramme Zeitleisten & Roadmaps