VORSCHAU
Chart Vizzard
Vizzlos KI-basierter Diagramm-GeneratorAspects where job satisfaction levels surpass 50% of the surveyed employees
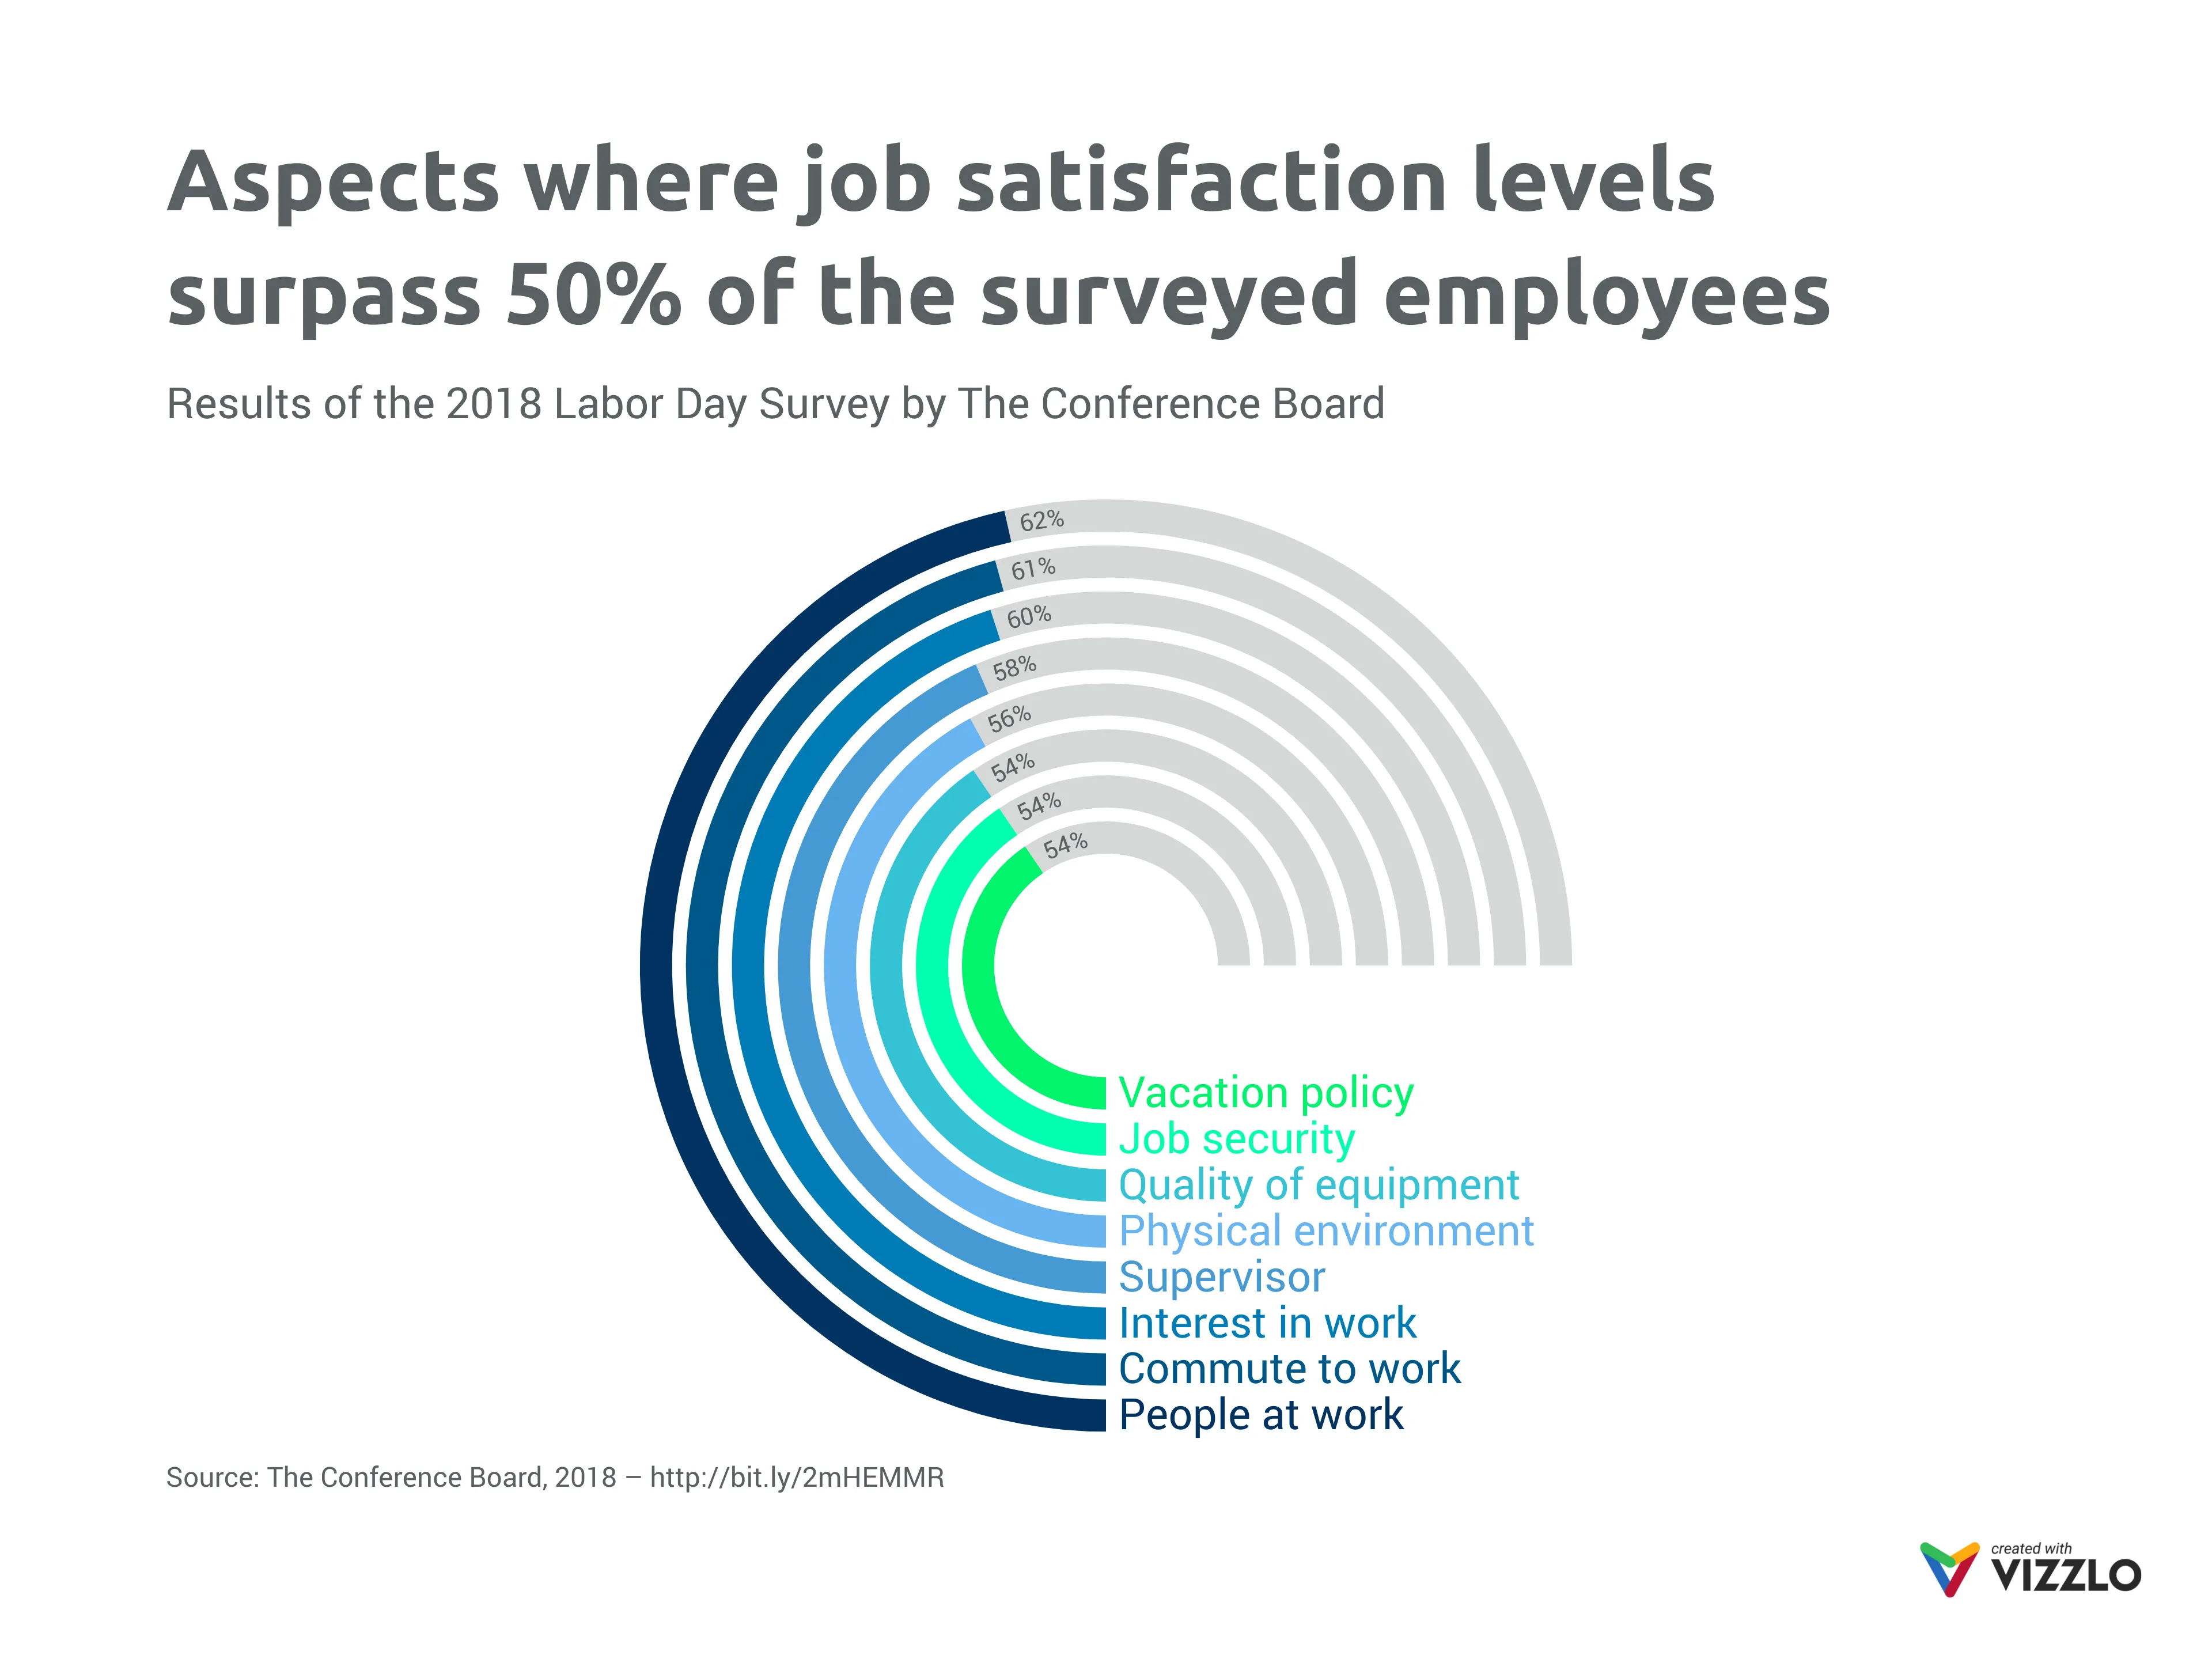
The latest LaborDay survey by The Conference Board shows that 51 percent of U.S. employees are satisfied with their jobs overall. 1,500 employees were polled to represent the U.S. workforce, and their contributions consisted of twenty-three different aspects to be rated. Among the poorly rated working-aspects were professional development and promotion opportunities, while the highest levels of satisfaction were found in the following categories.
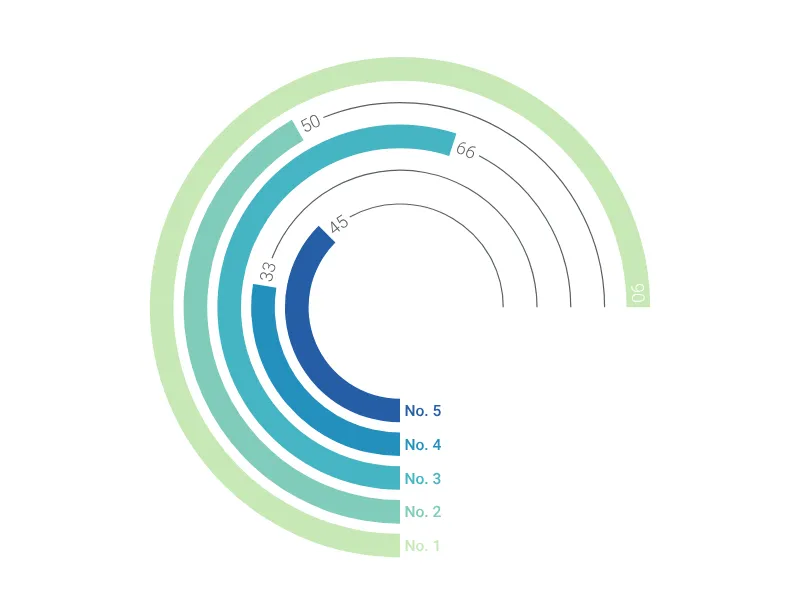
Dies ist ein Beispiel für Vizzlos "Radiales Balkendiagramm"
Dieses kreisförmige Balkendiagramm ist so stilvoll wie möglich für Ihre nächste Präsentation.
Balken- & Säulendiagramme Kreisdiagramme Messanzeigen- & Statusdiagramme