VORSCHAU
Chart Vizzard
Vizzlos KI-basierter Diagramm-Generator10 Years of TV Series
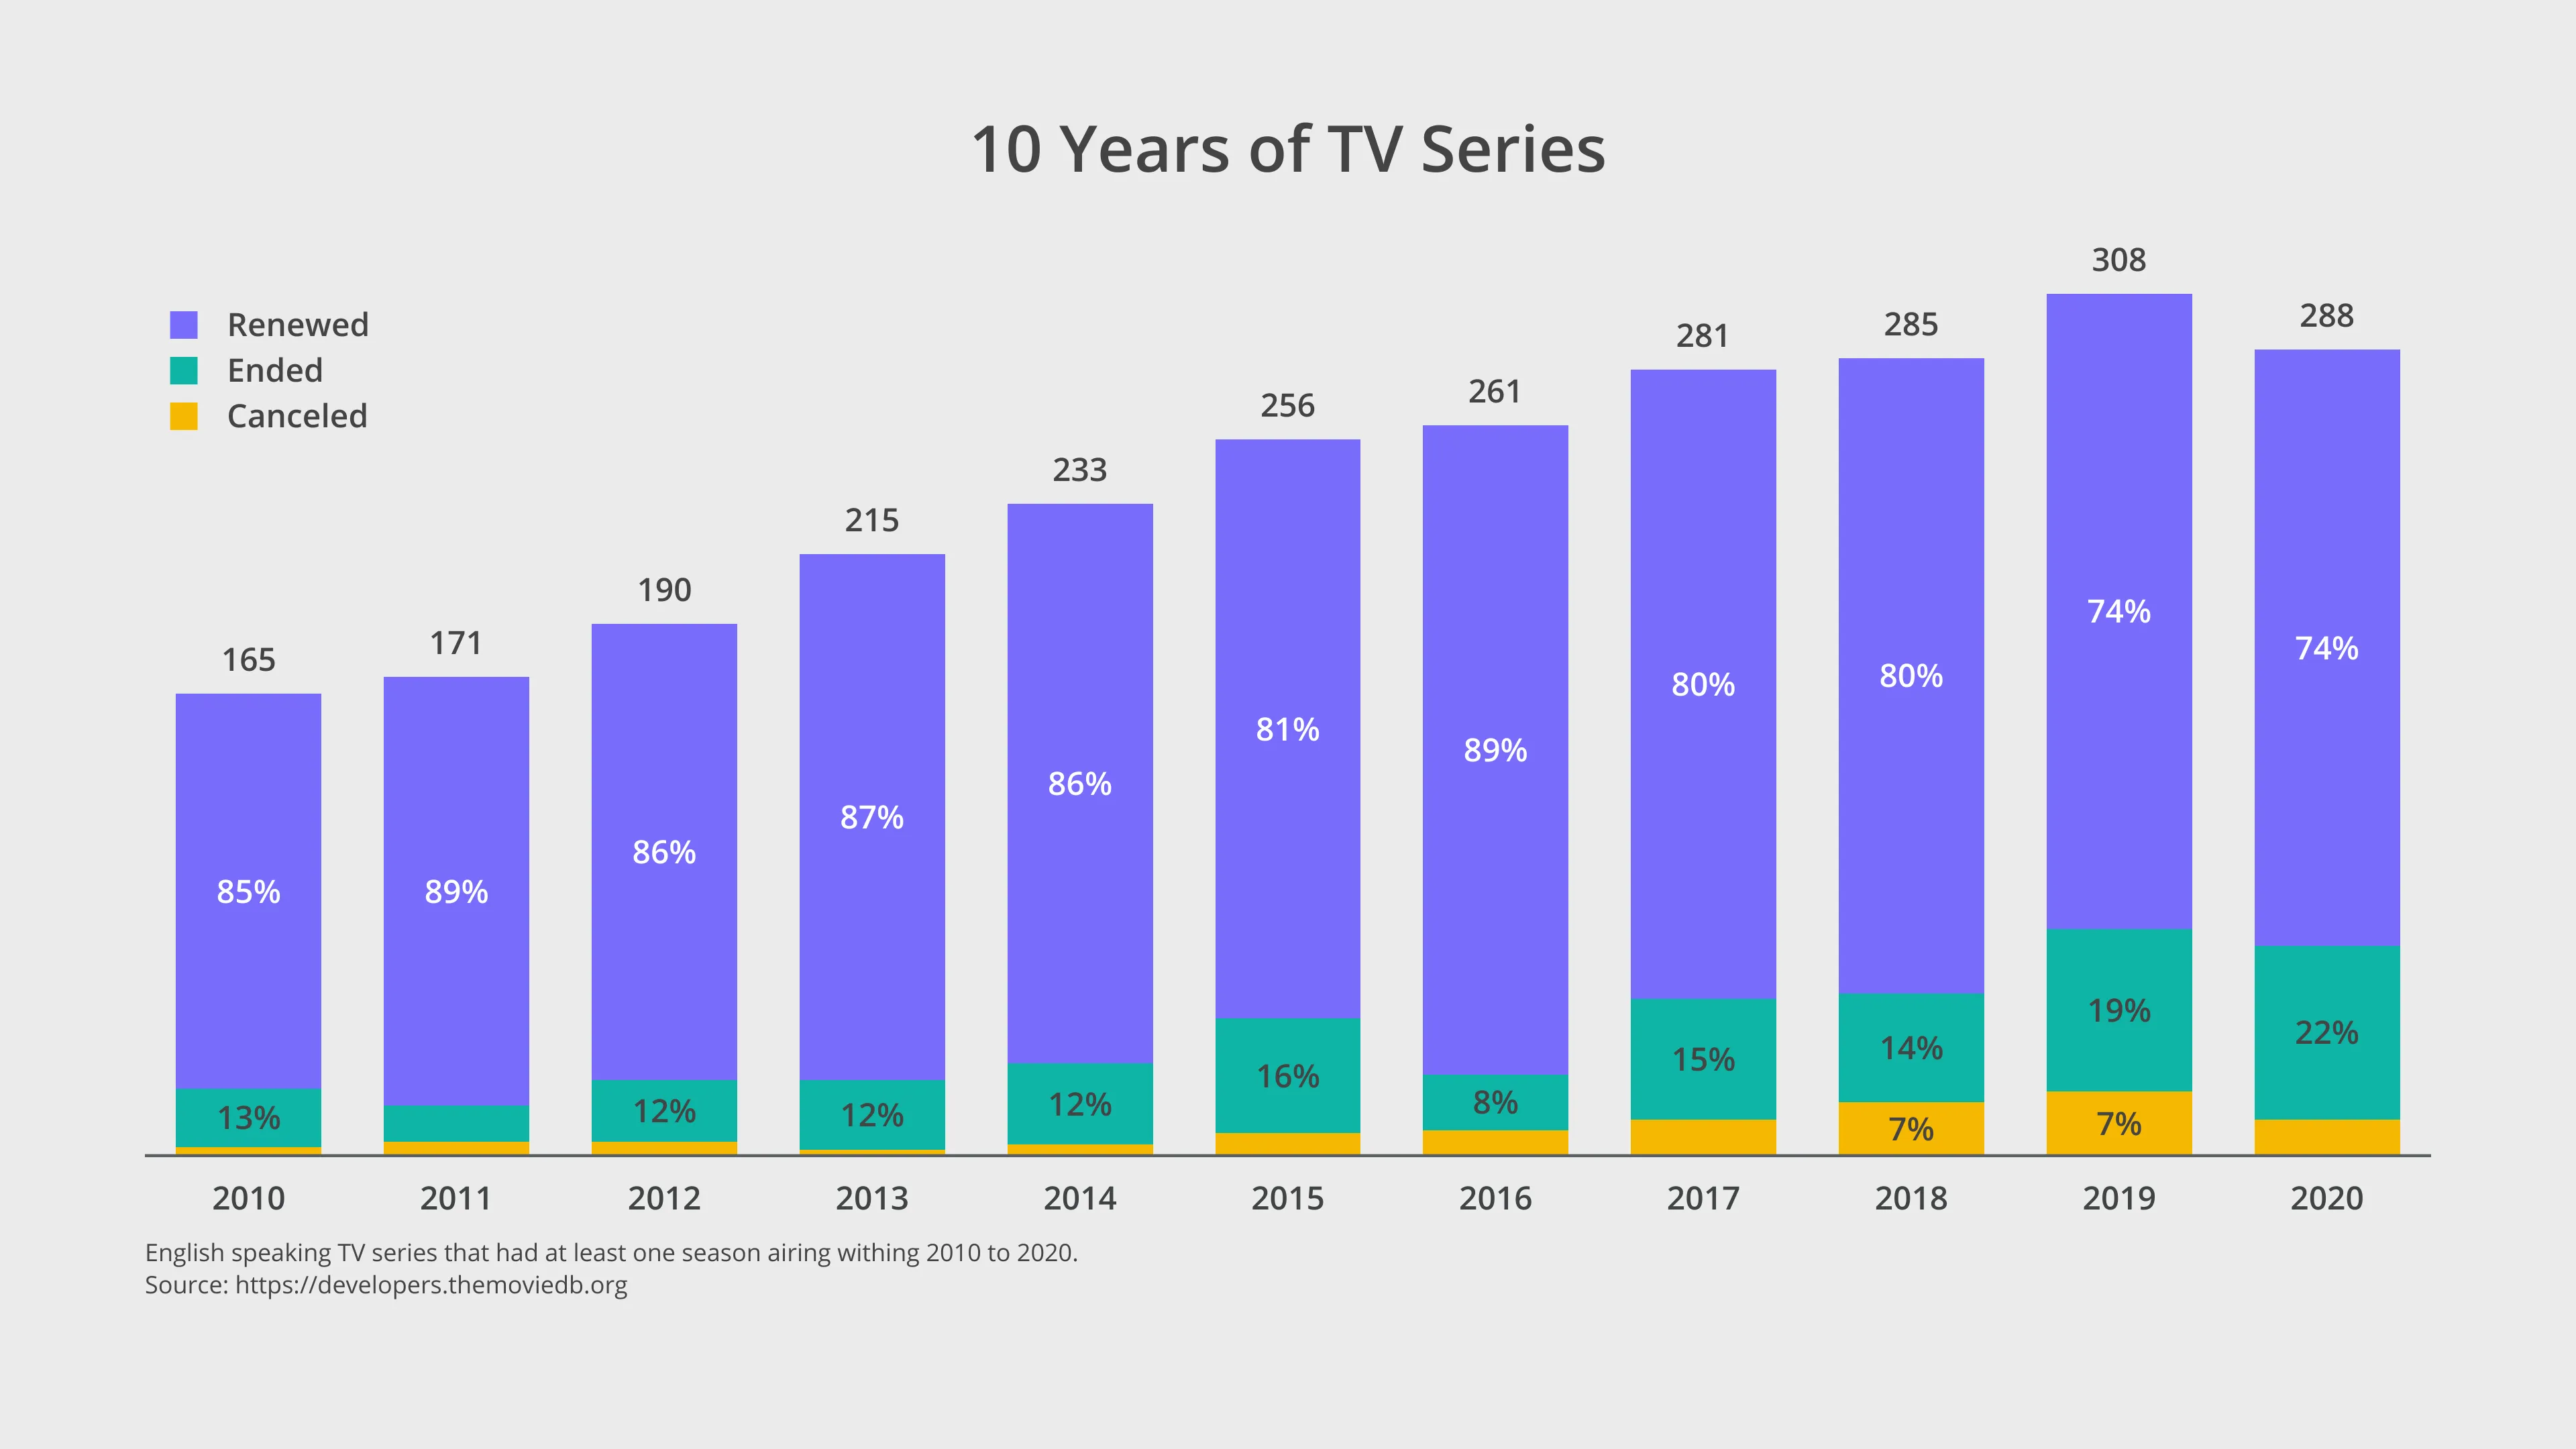
With the rise of streaming services, TV series have become more and more popular. Since 2010 the number of series that air every year has almost doubled!
Series have the advantage of giving the viewer more time to get to know and love the characters. This is why when a show is cancelled it feels like a personal blow.
But how many series are cancelled? It seems like every year the percentage is stable around 5% to 7% with the worst year to date being 2019 where 23 shows were cancelled and 58 ended.
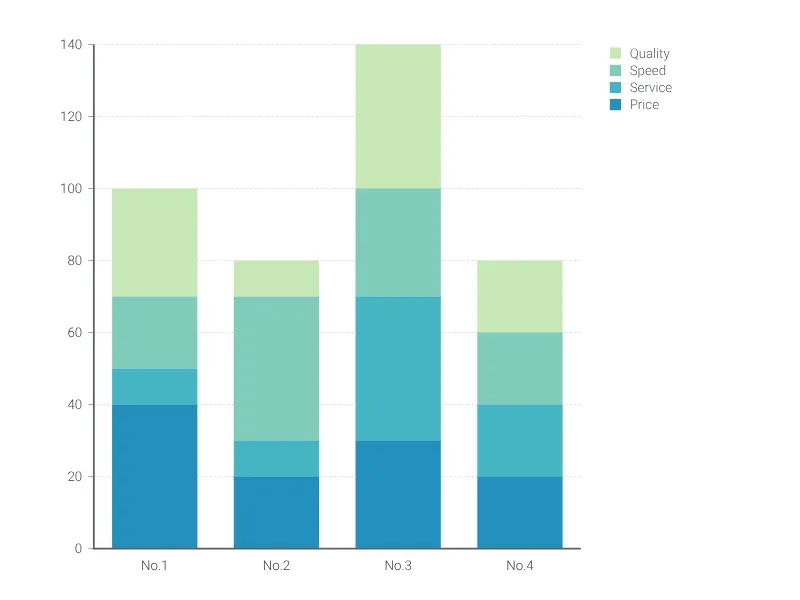
Dies ist ein Beispiel für Vizzlos "Gestapeltes Balkendiagramm"
Heben Sie Teil-zu-Ganzes-Beziehungen von Kategorien hervor und vergleichen Sie verschiedene Gruppen mit diesem gestapelten Balkendiagramm.