VORSCHAU
Chart Vizzard
Vizzlos KI-basierter Diagramm-Generator16-24 is the Loneliest Number
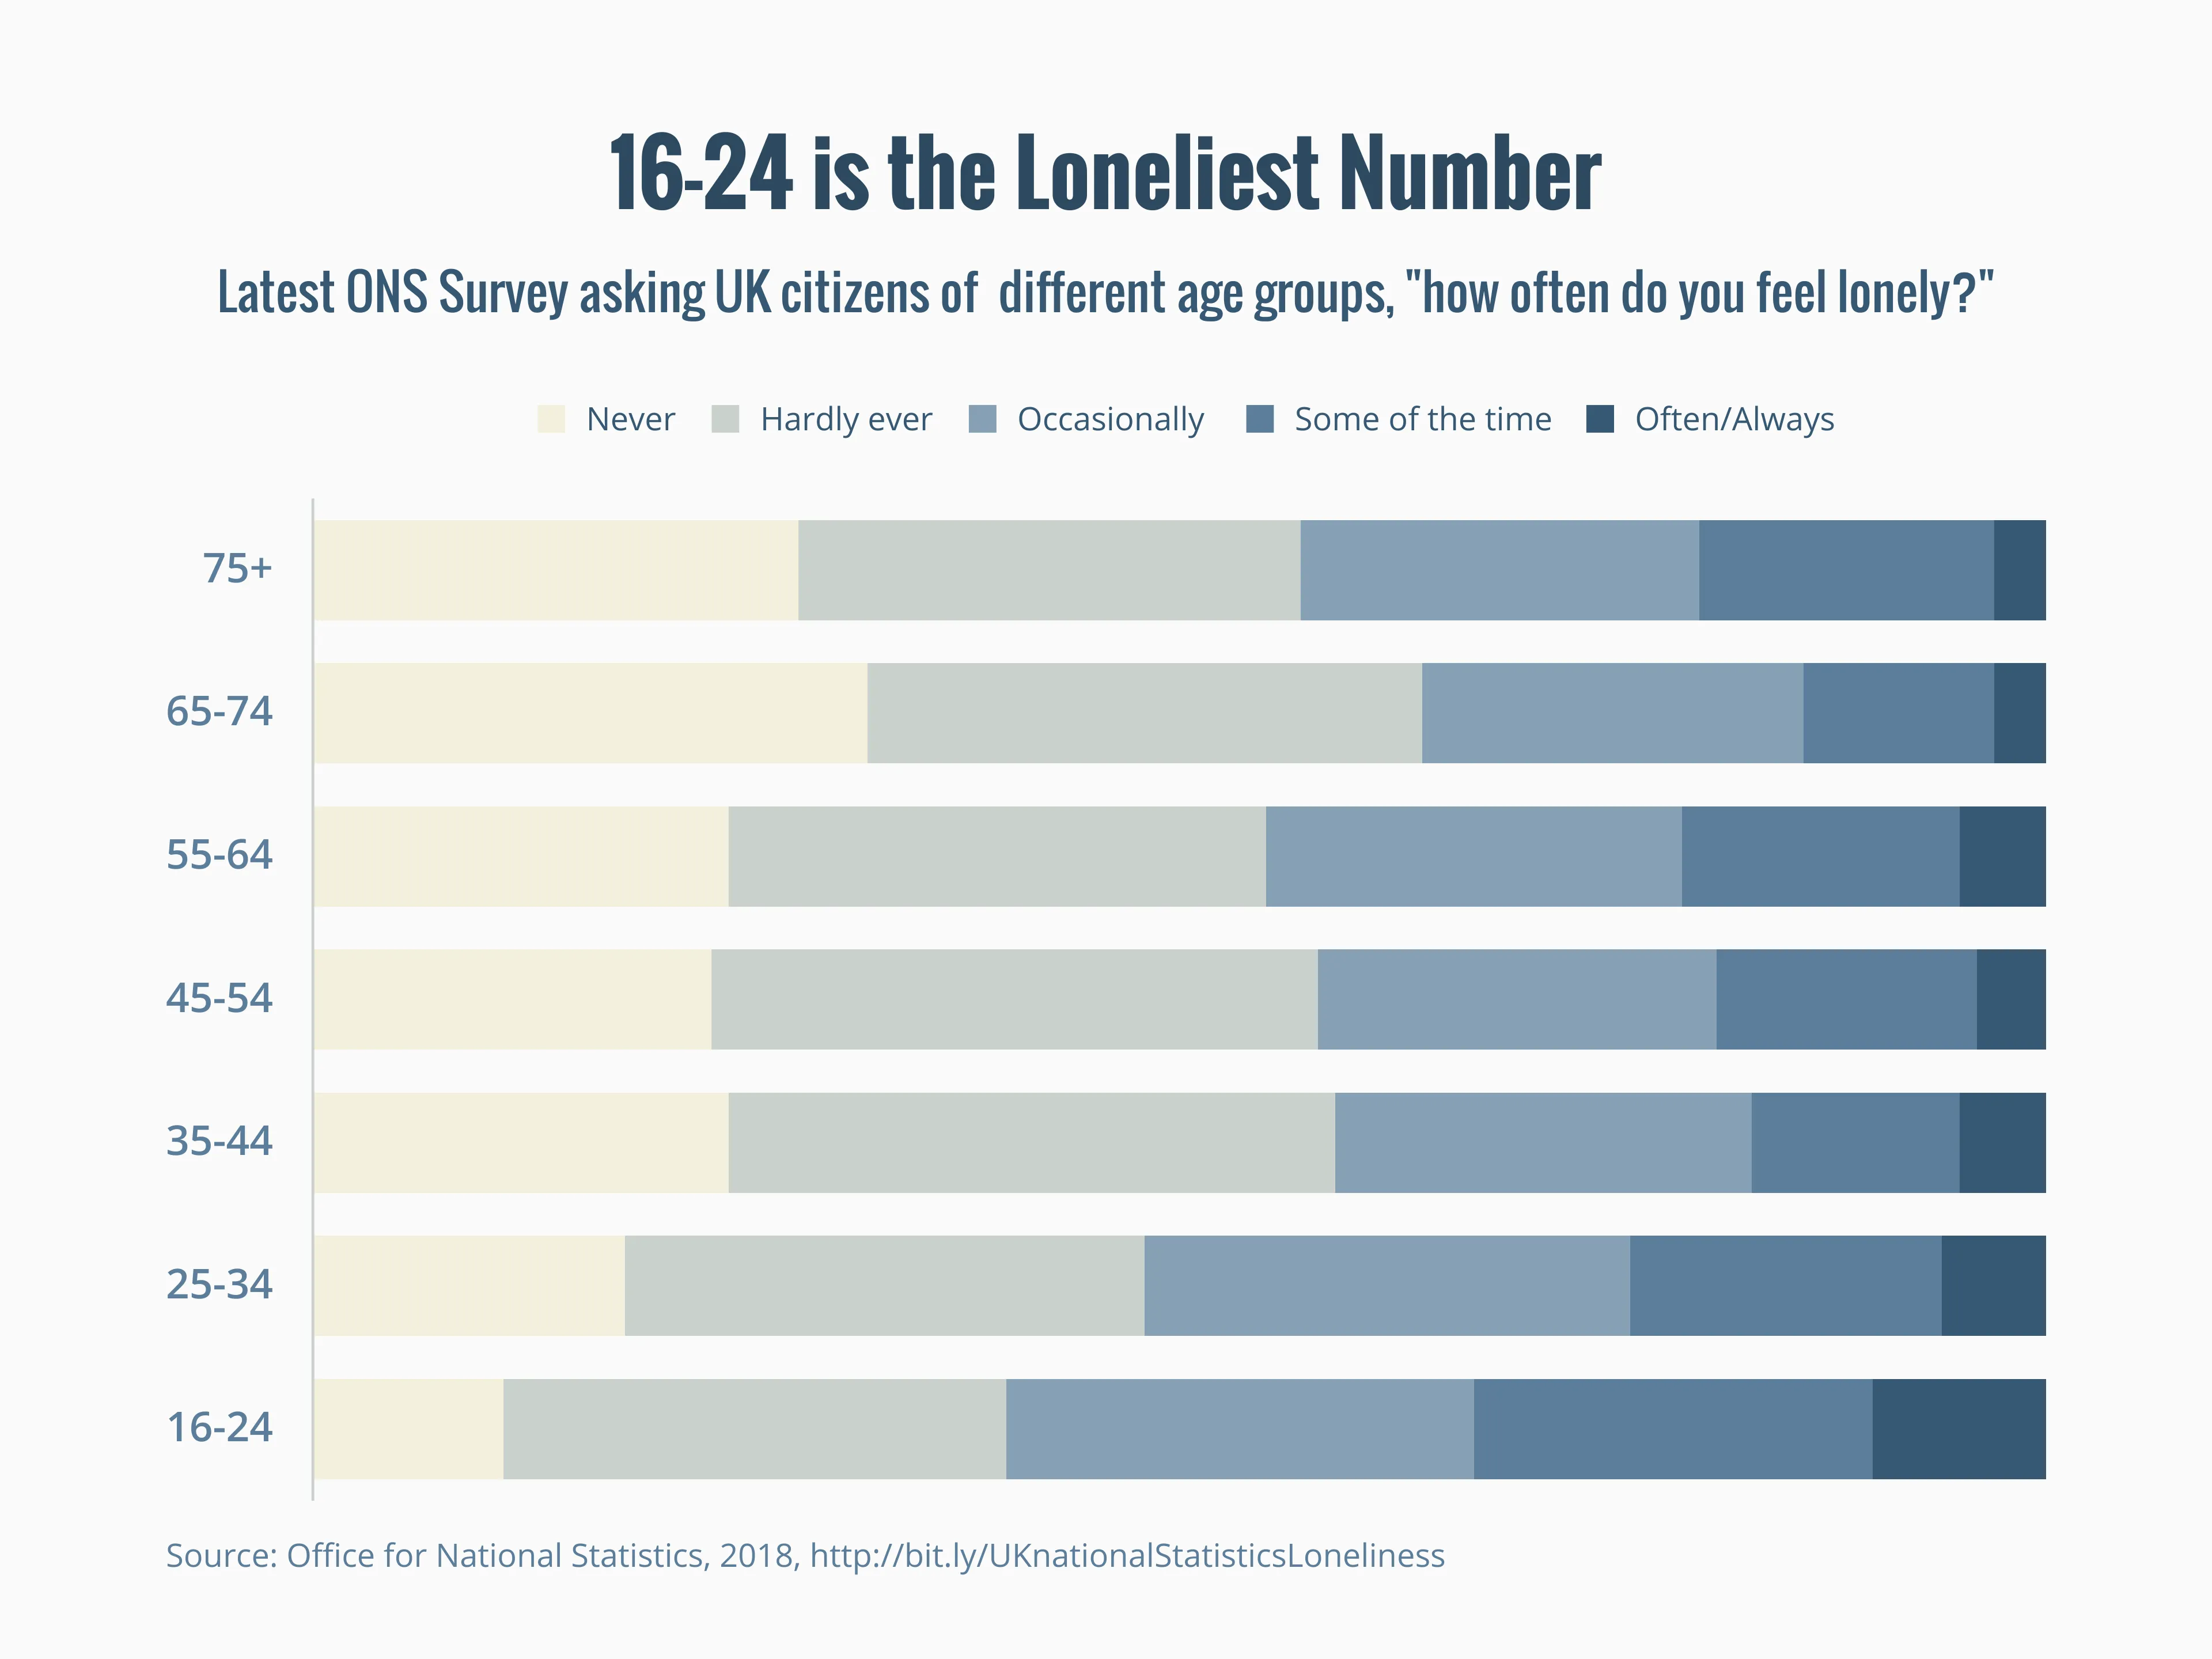
The winter holidays can be a tough time of year for those without the fortune to have their family and loved ones around them. We often worry for the loneliness of the elderly, but the latest survey by the Office for National Statistics (UK) paints a very different picture–the 16-24 “Gen Z” age group reports feeling the loneliest the most often, while the 65-74 age group feels this way the least of all those questioned.
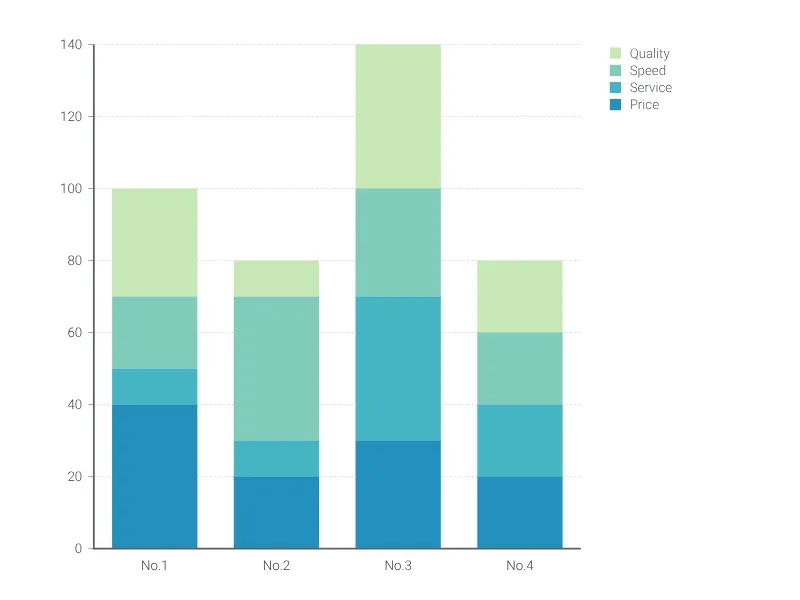
Dies ist ein Beispiel für Vizzlos "Gestapeltes Balkendiagramm"
Heben Sie Teil-zu-Ganzes-Beziehungen von Kategorien hervor und vergleichen Sie verschiedene Gruppen mit diesem gestapelten Balkendiagramm.