VORSCHAU
Chart Vizzard
Vizzlos KI-basierter Diagramm-GeneratorHours spent with digital Media
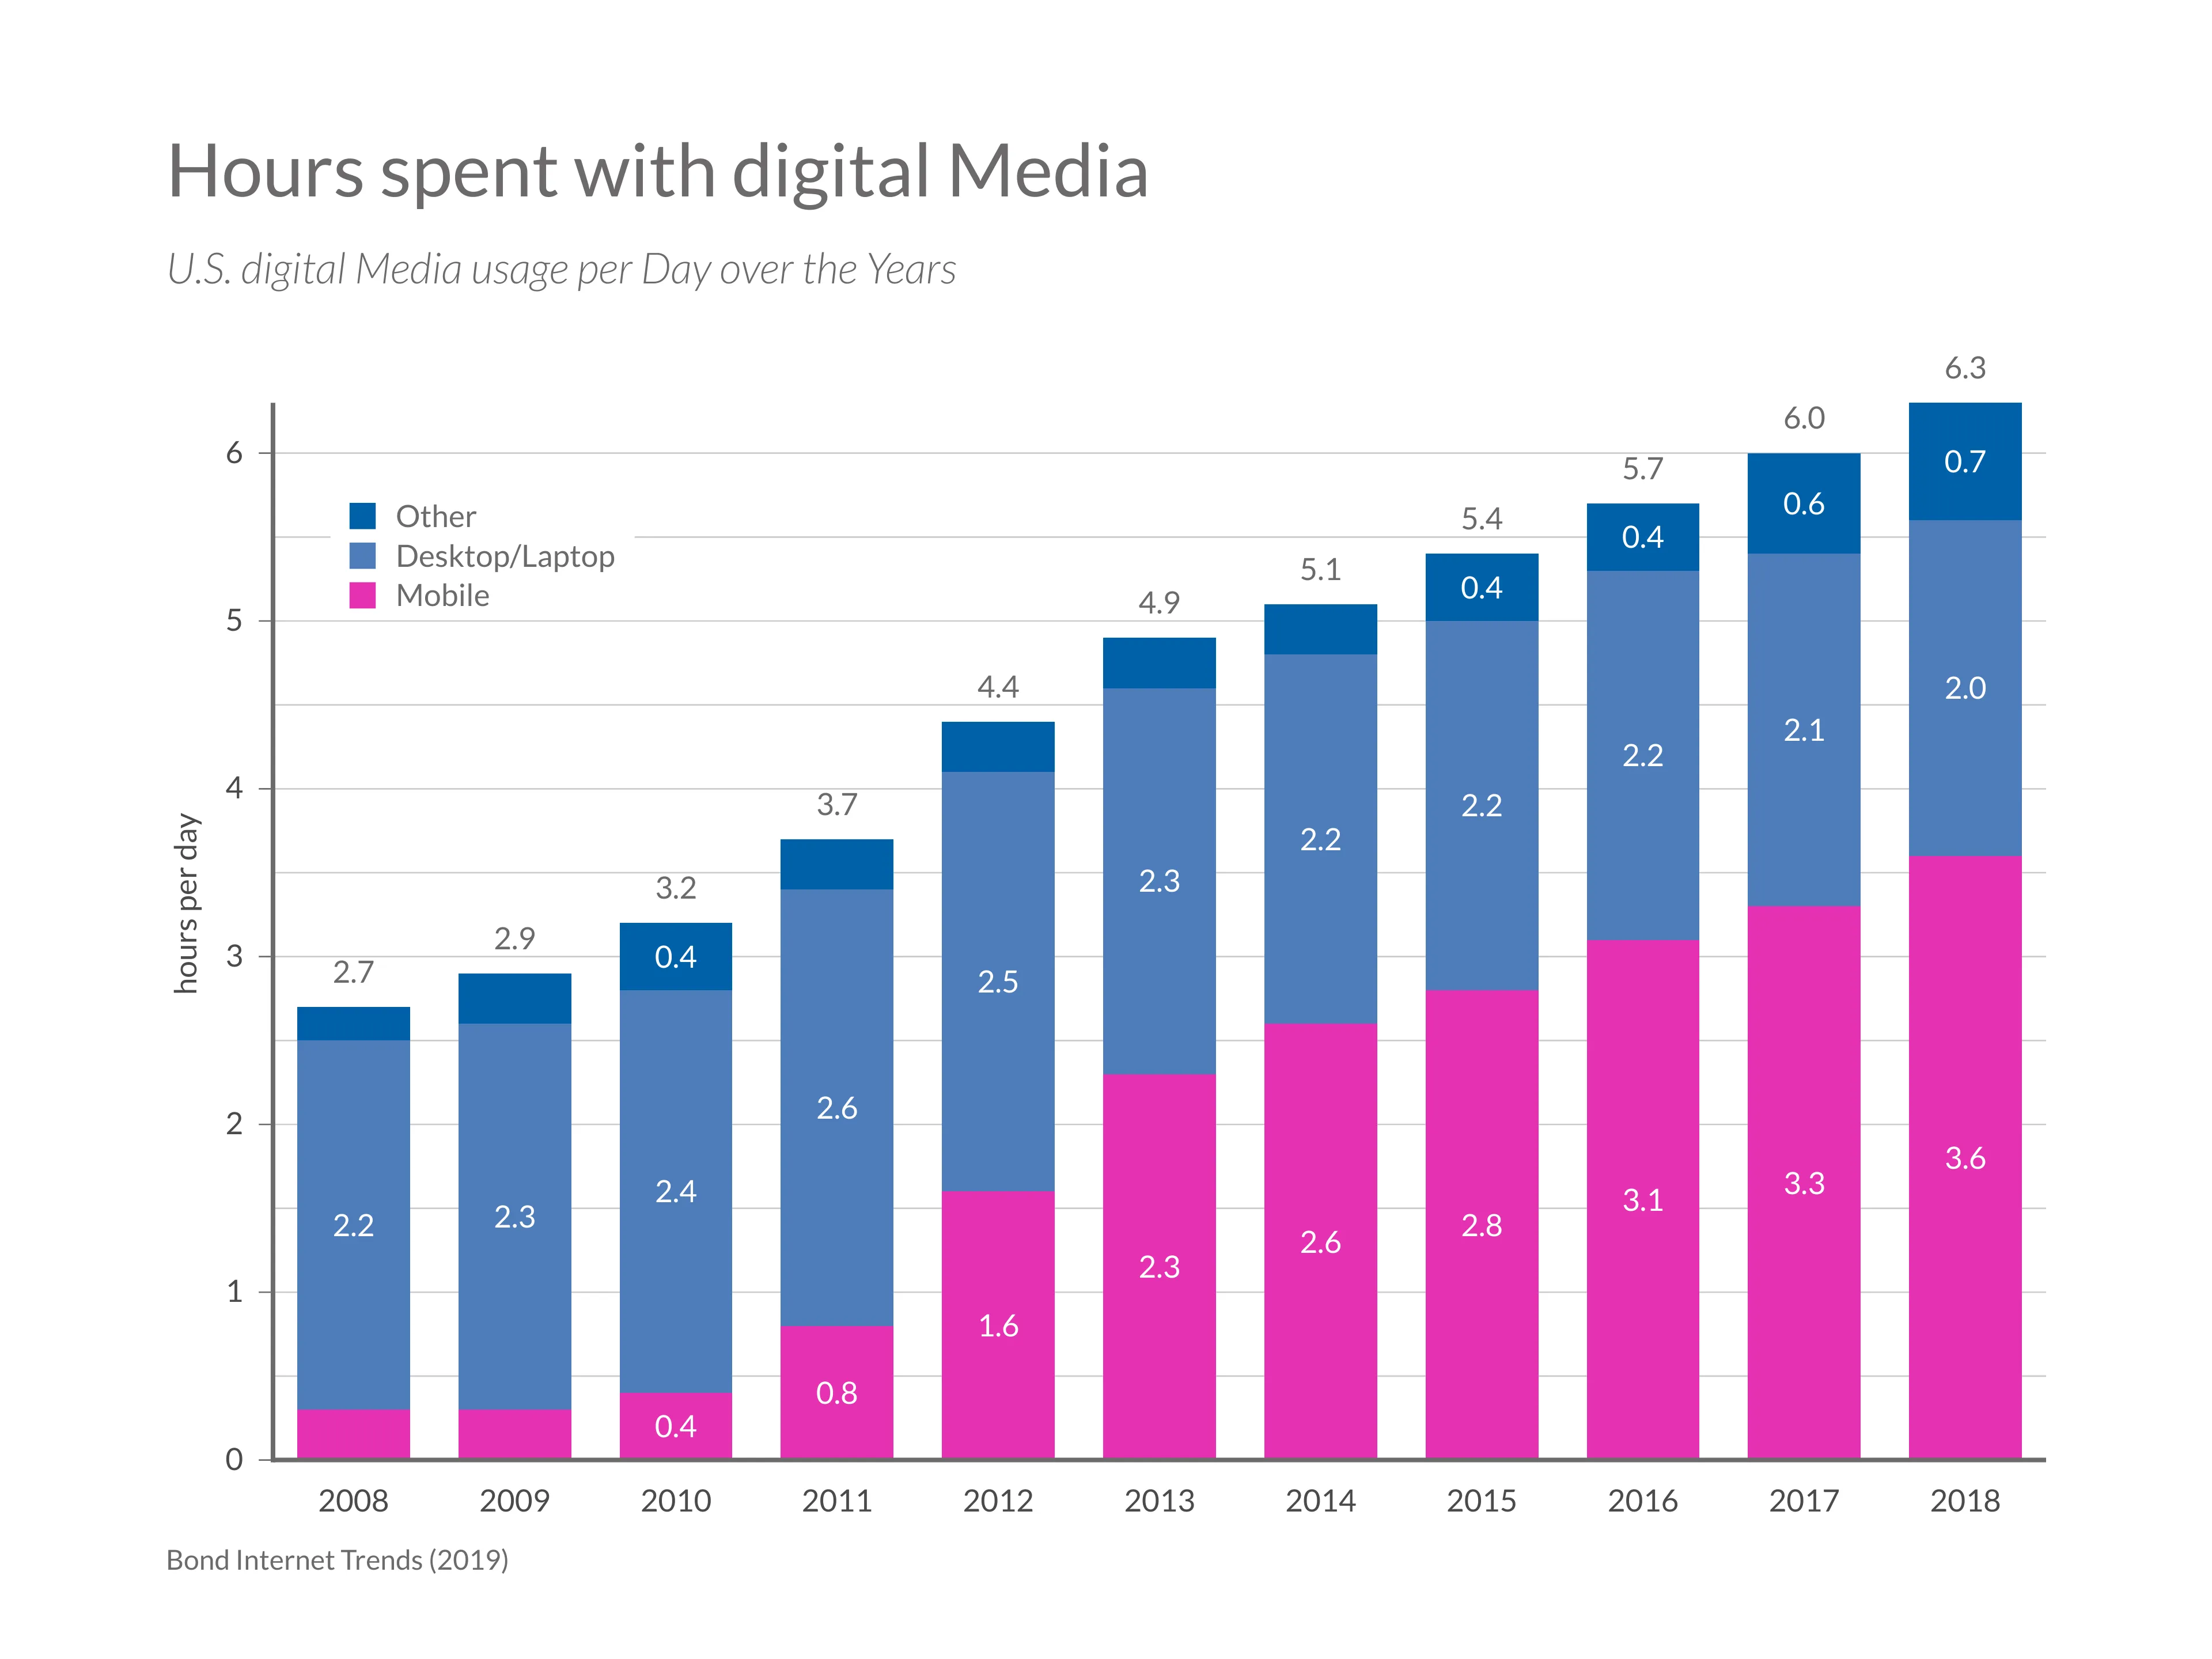
Todays chart tracks usage of digital media for Americans over the last years since 2008. With the first iPhone coming out the year before, we can track the rapid growth of smartphones and their impact on our consumption of digital media and therefor impact on our daily life. In these ten years, media usage has more than doubled by the impact of smartphones alone, while usage of other devices has more or less stayed the same.
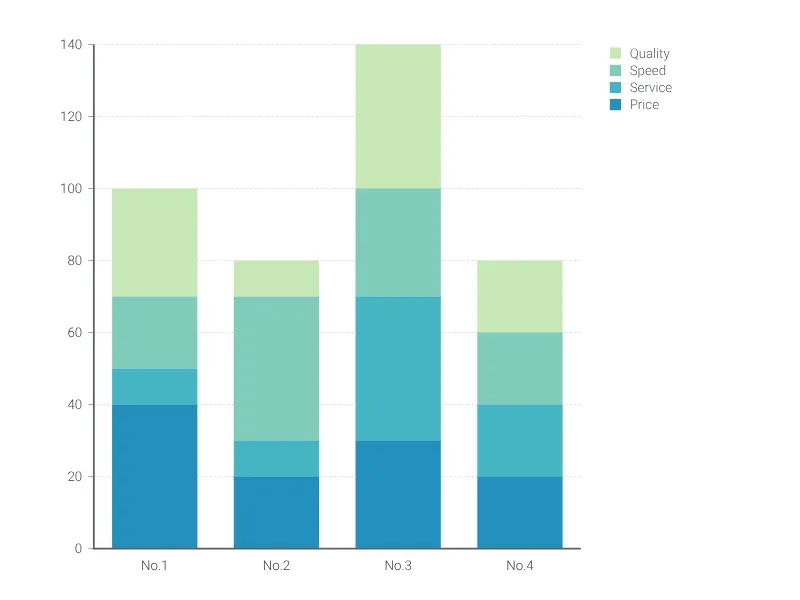
Dies ist ein Beispiel für Vizzlos "Gestapeltes Balkendiagramm"
Heben Sie Teil-zu-Ganzes-Beziehungen von Kategorien hervor und vergleichen Sie verschiedene Gruppen mit diesem gestapelten Balkendiagramm.