Chart Vizzard
Vizzlos KI-basierter Diagramm-GeneratorMoney spent on Halloween
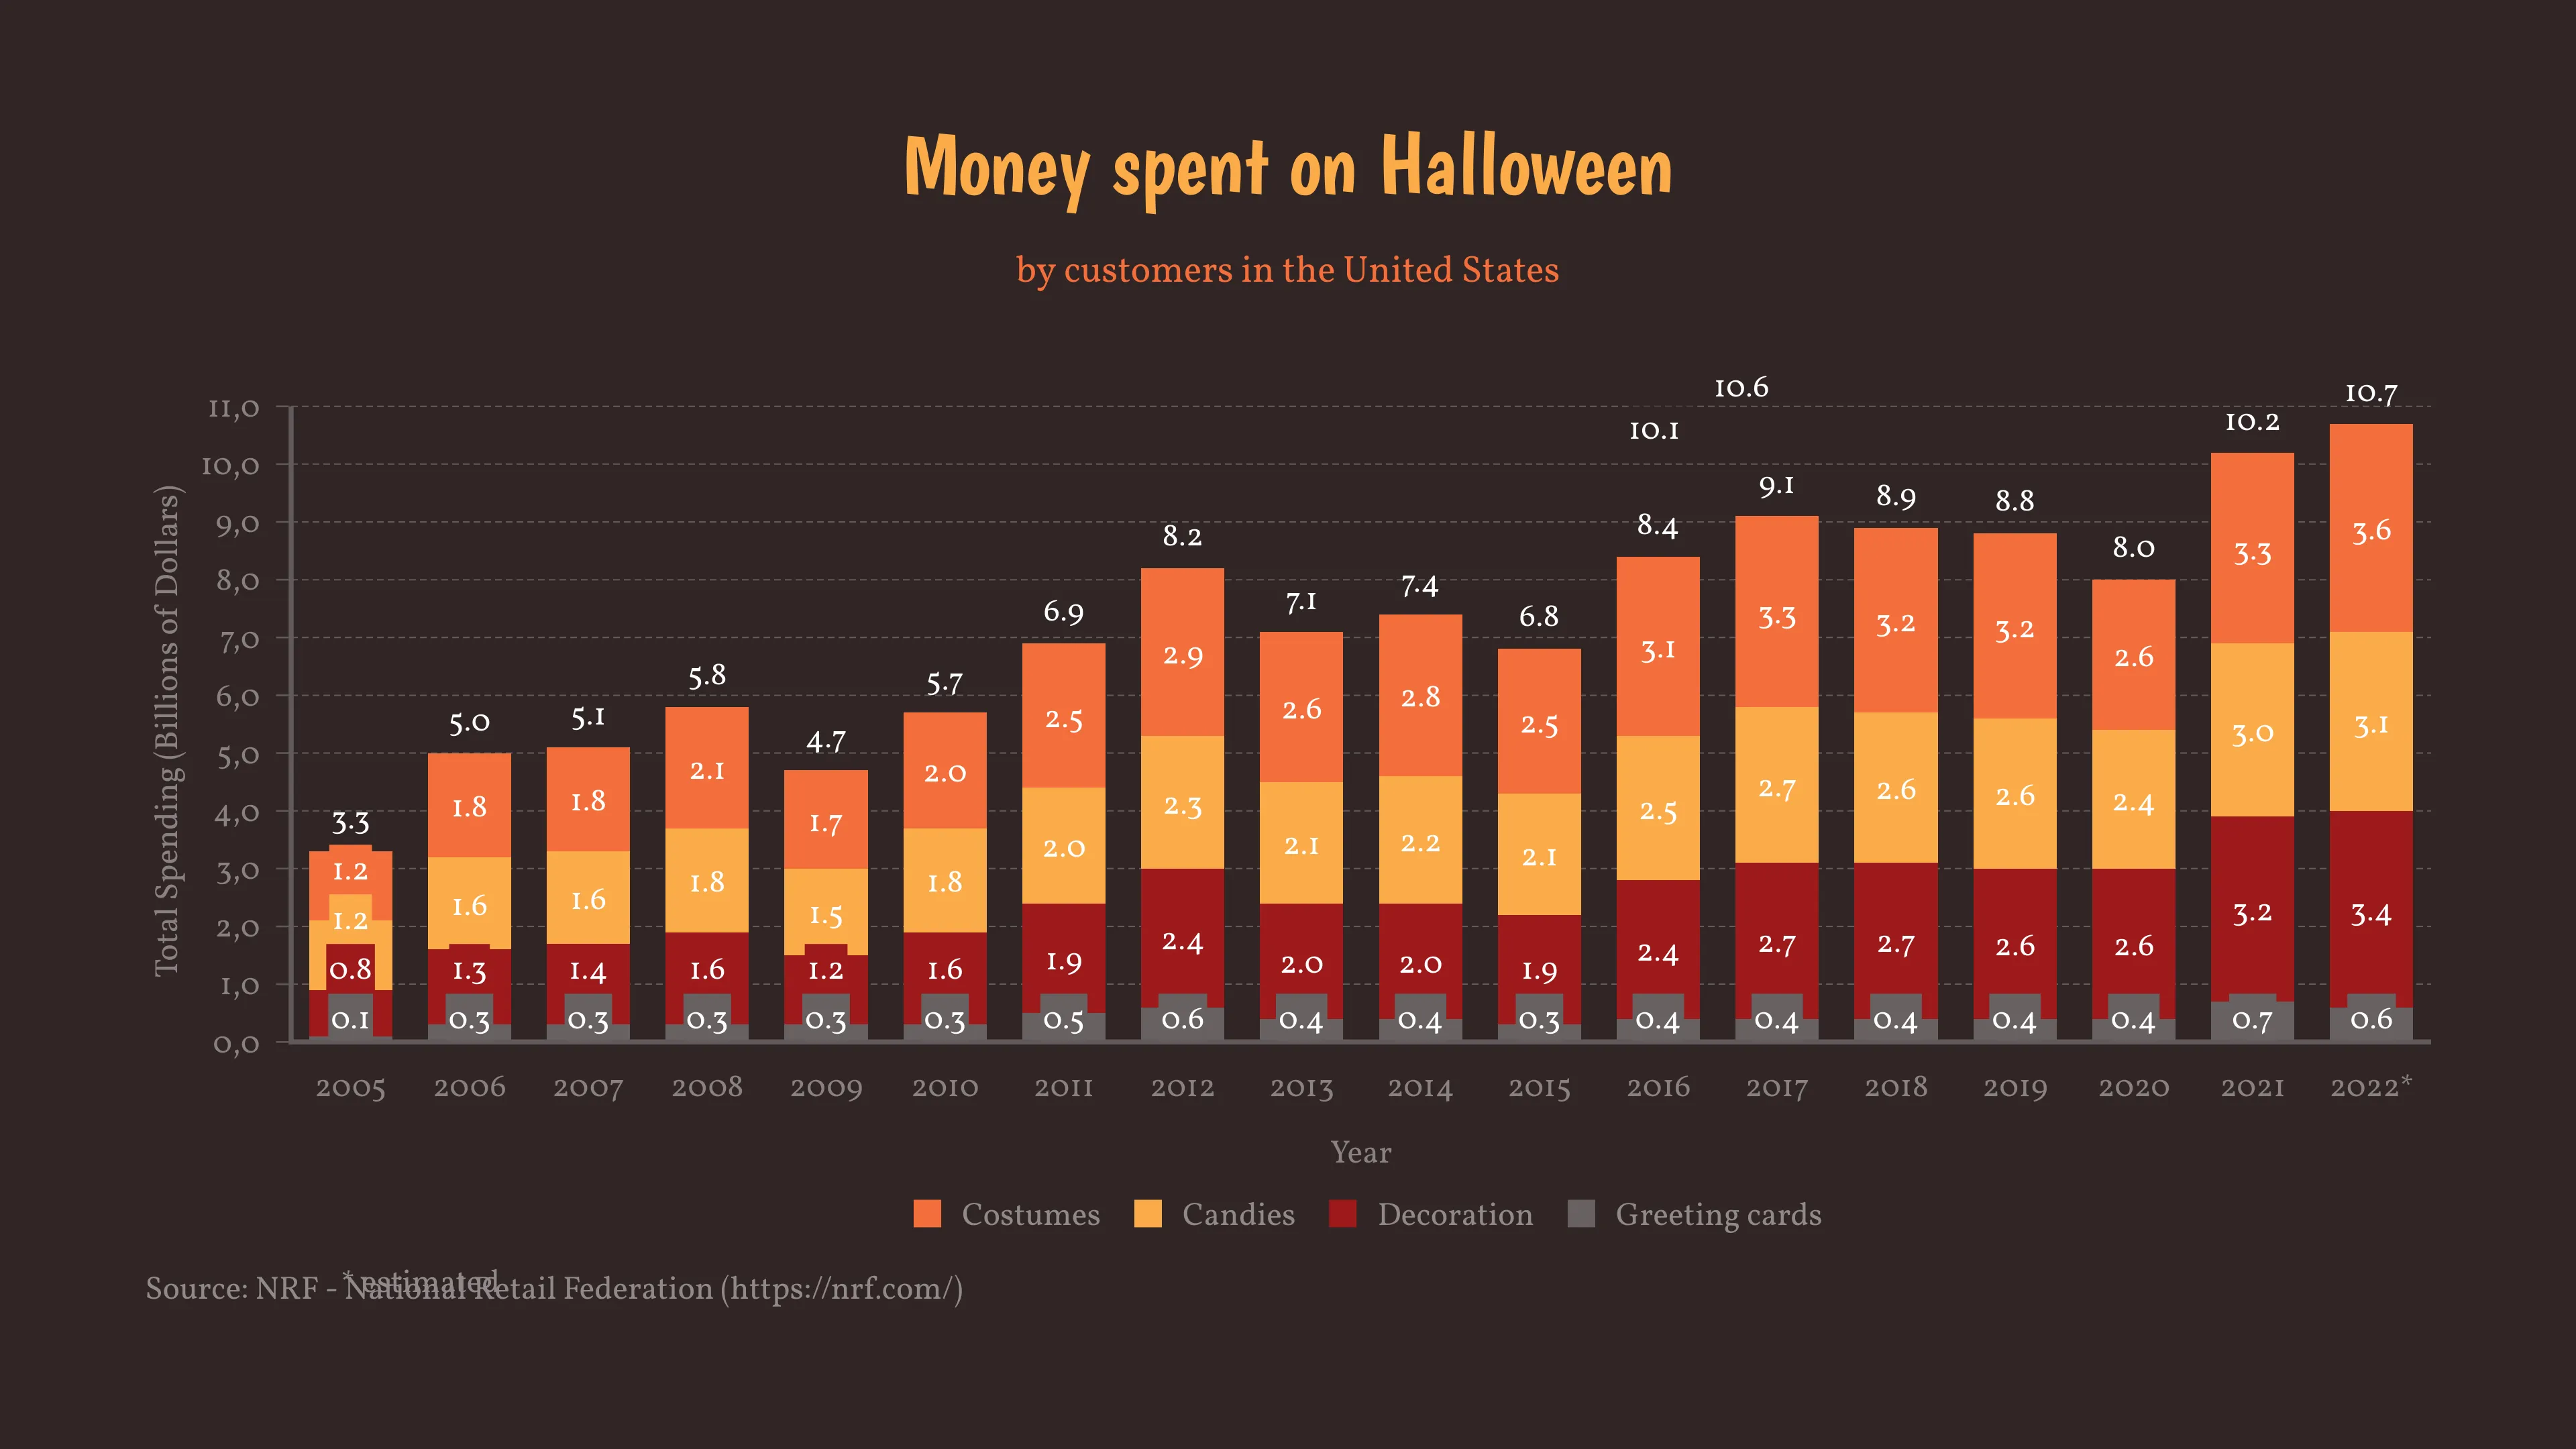
Halloween is among the most popular holidays and events in the US. This year, 69% of Americans plan to celebrate this holiday by handing out candy (67%), decorating their home or yard (51%), dressing up in costume (47%), carving a pumpkin (44%), or either throwing or attending a Halloween party (28%). The amount of money expected to be spent this year is as scary as Halooween decorations and costumes: 10.6 billion USD! That would break the record of 10.1 billion USD from 2021.
The largest expected expenditure group for Halloween celebration is Costumes, which is mostly inspired by online searches on Instagram and TikTok. Children prefer dressing up as superheroes and princesses, while adults enjoy more spooky costumes like witches, vampires, ghosts, zombies and devils. Even pets take part in dressing up, being pumpkin, hot dog and bat the top three costumes.
Sources:
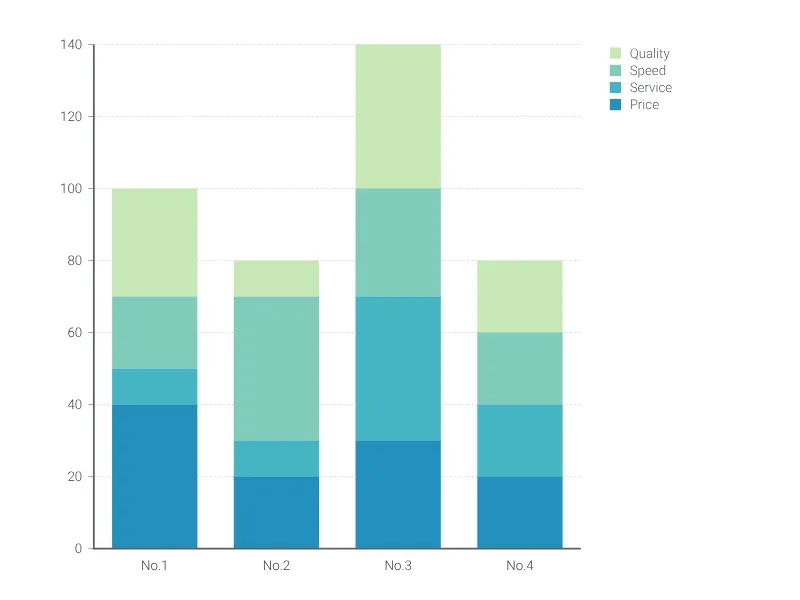
Dies ist ein Beispiel für Vizzlos "Gestapeltes Balkendiagramm"
Heben Sie Teil-zu-Ganzes-Beziehungen von Kategorien hervor und vergleichen Sie verschiedene Gruppen mit diesem gestapelten Balkendiagramm.