Chart Vizzard
Vizzlos KI-basierter Diagramm-GeneratorBrexit Timeline
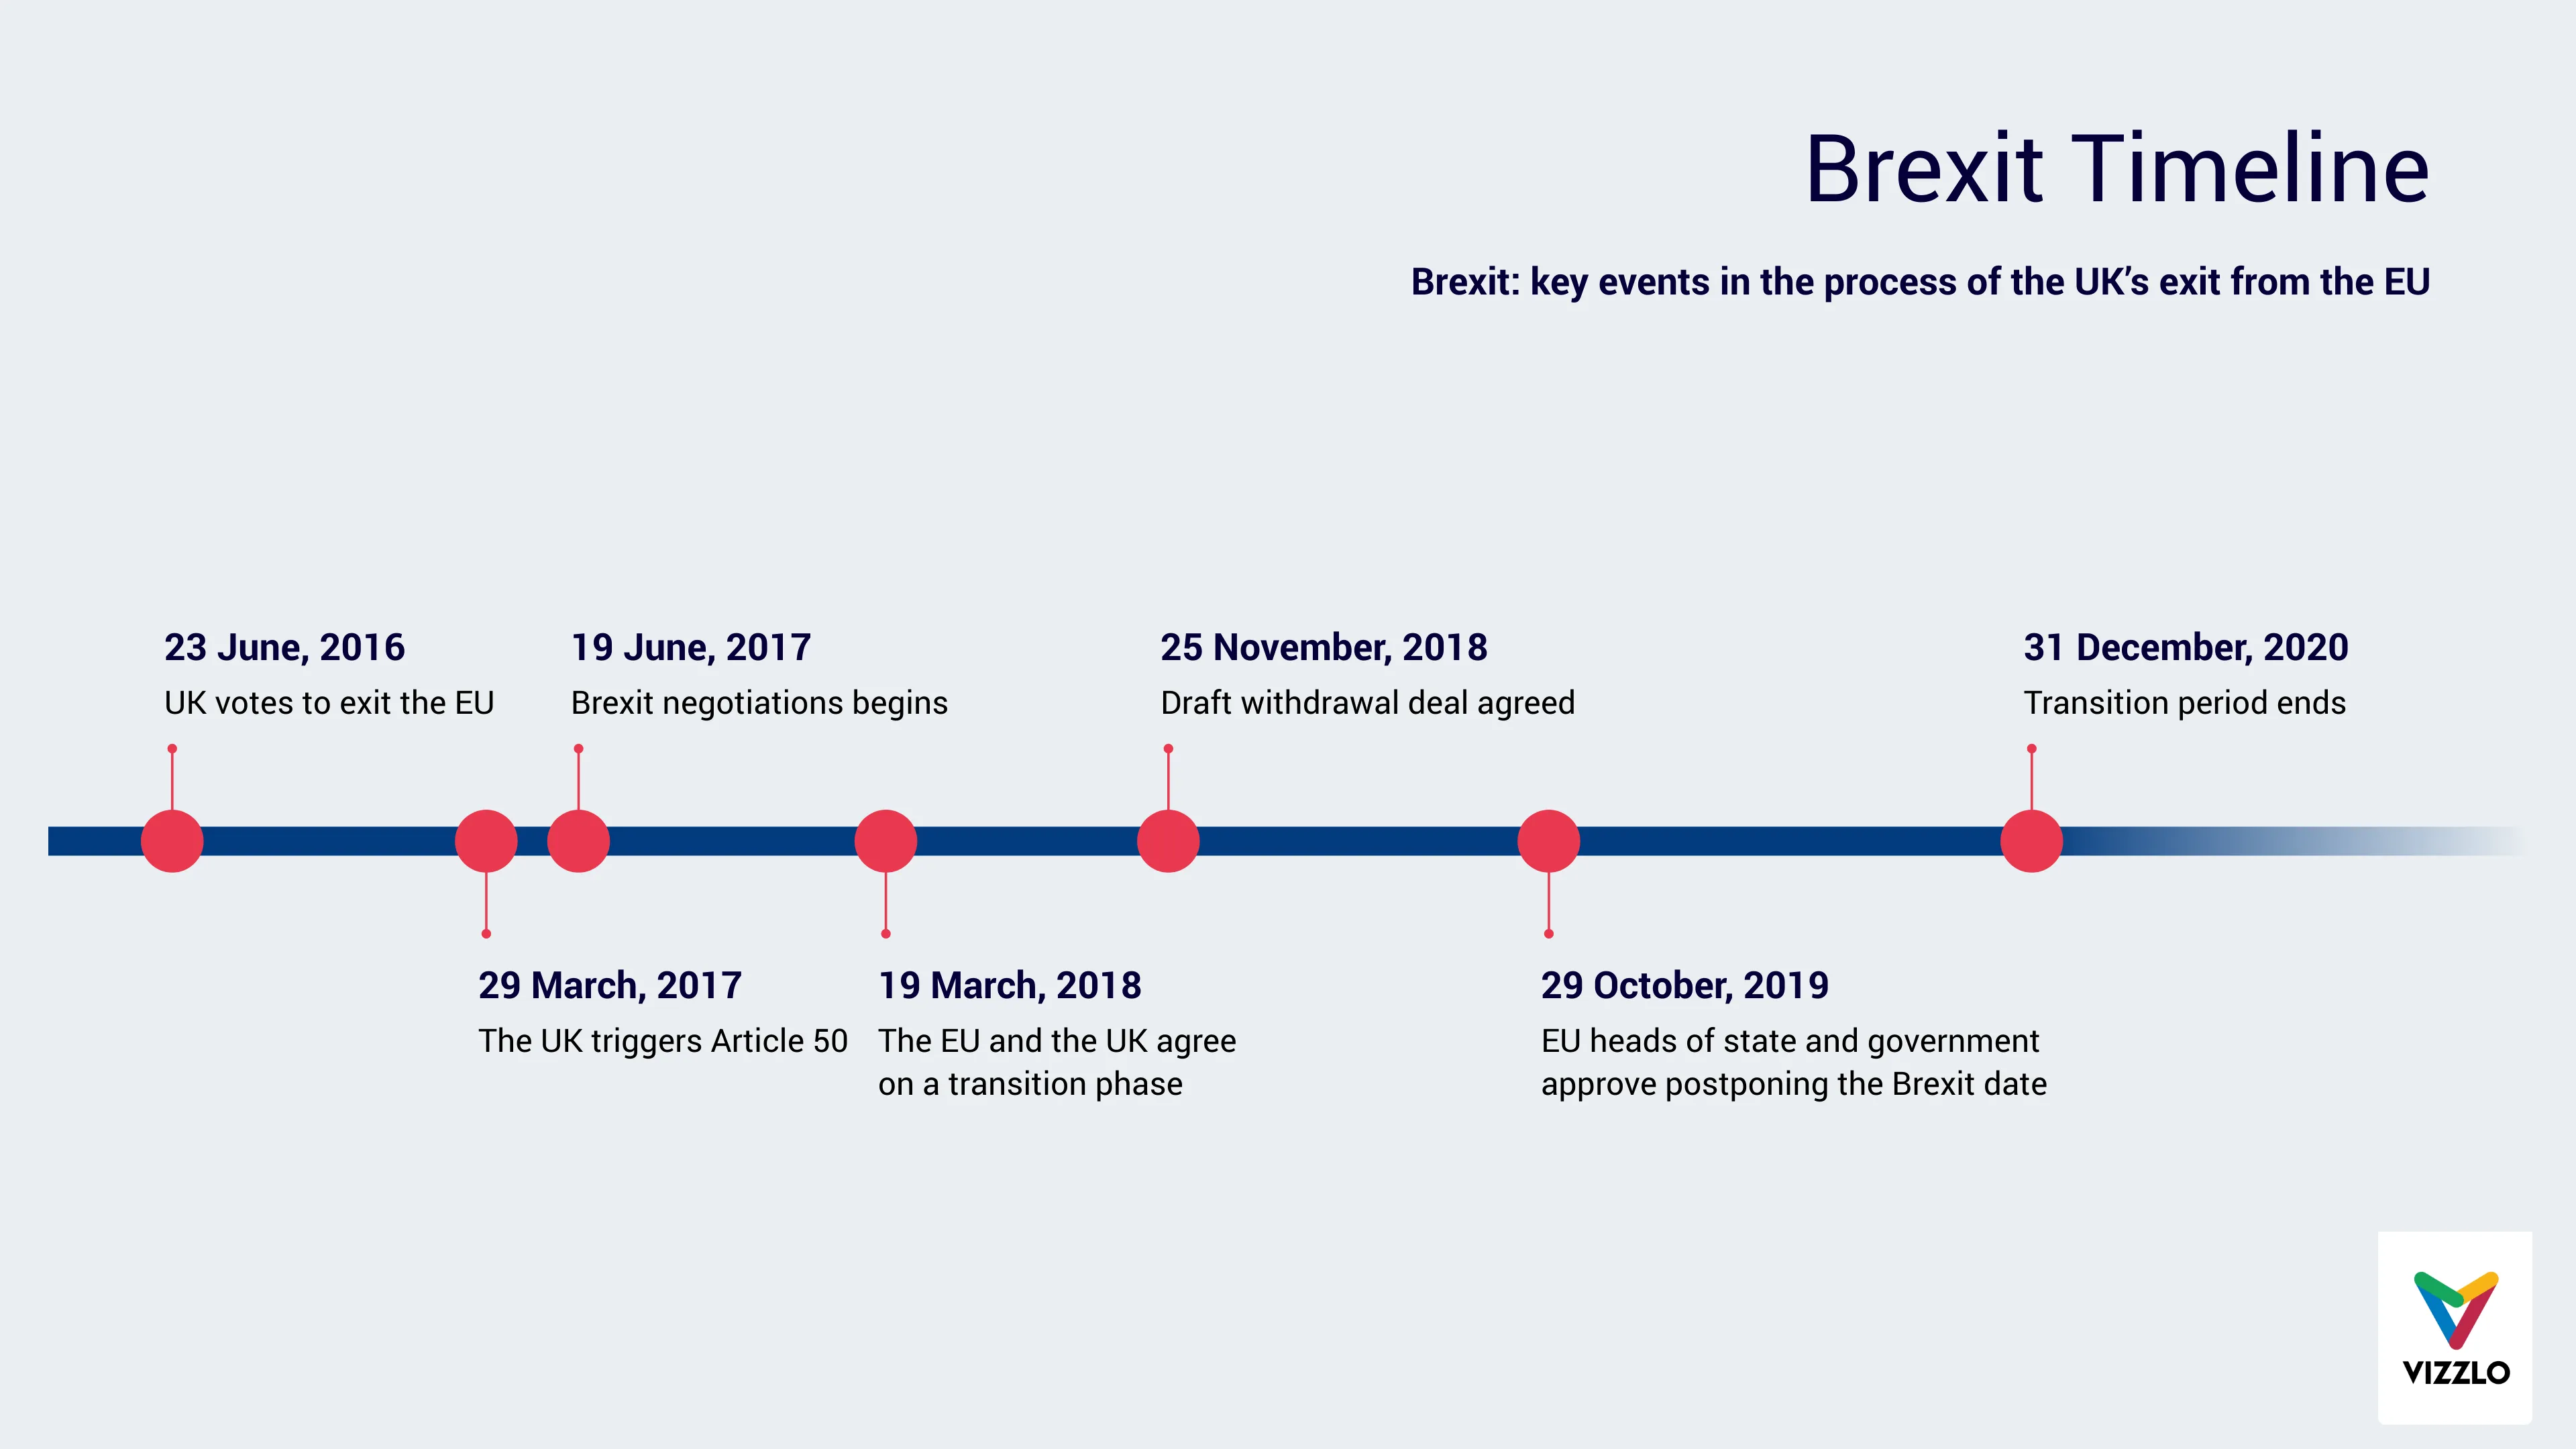
This timeline chart gives an overview of the key events in the process of the UK’s exit from the European Union.
On 26 June 2016, the UK votes to leave the European Union with the result of 51.9% voters vote to leave. About one year later, the Prime Minister triggered Article 50 of the Treaty on the European Union even if Donald Tusk said he believed Article 50 can be reserved. After the negotiations begin, the UK and the EU agree on the transition phase starting from March 2018. The end of the transition period is expected by December 2020.
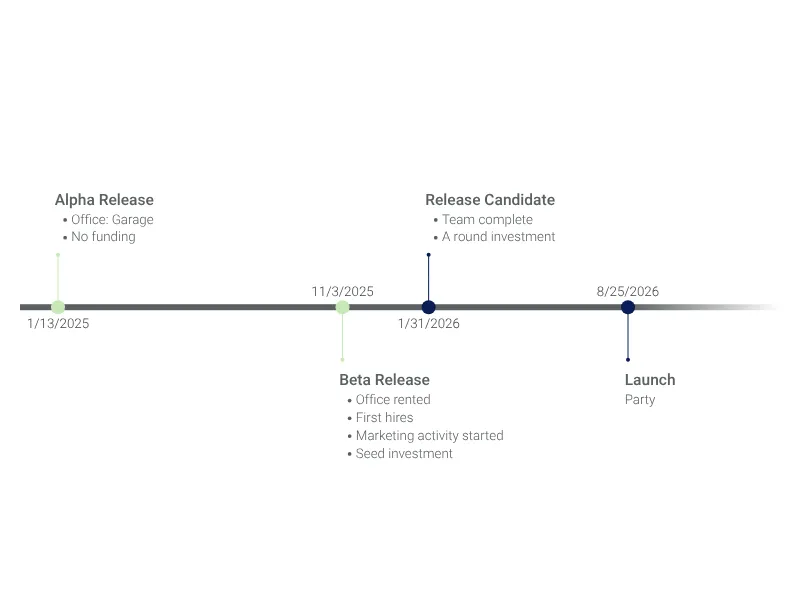
Dies ist ein Beispiel für Vizzlos "Zeitachsendiagramm"
Effiziente Projektplanung und -terminierung mit beeindruckenden Zeitachsen – mit nur wenigen Klicks.
Projektmanagement Zeitbasierte Diagramme Meilenstein-Diagramme Zeitleisten & Roadmaps