Chart Vizzard
Vizzlos KI-basierter Diagramm-GeneratorInside FIFA’s $3.76B 2026 World Cup Budget
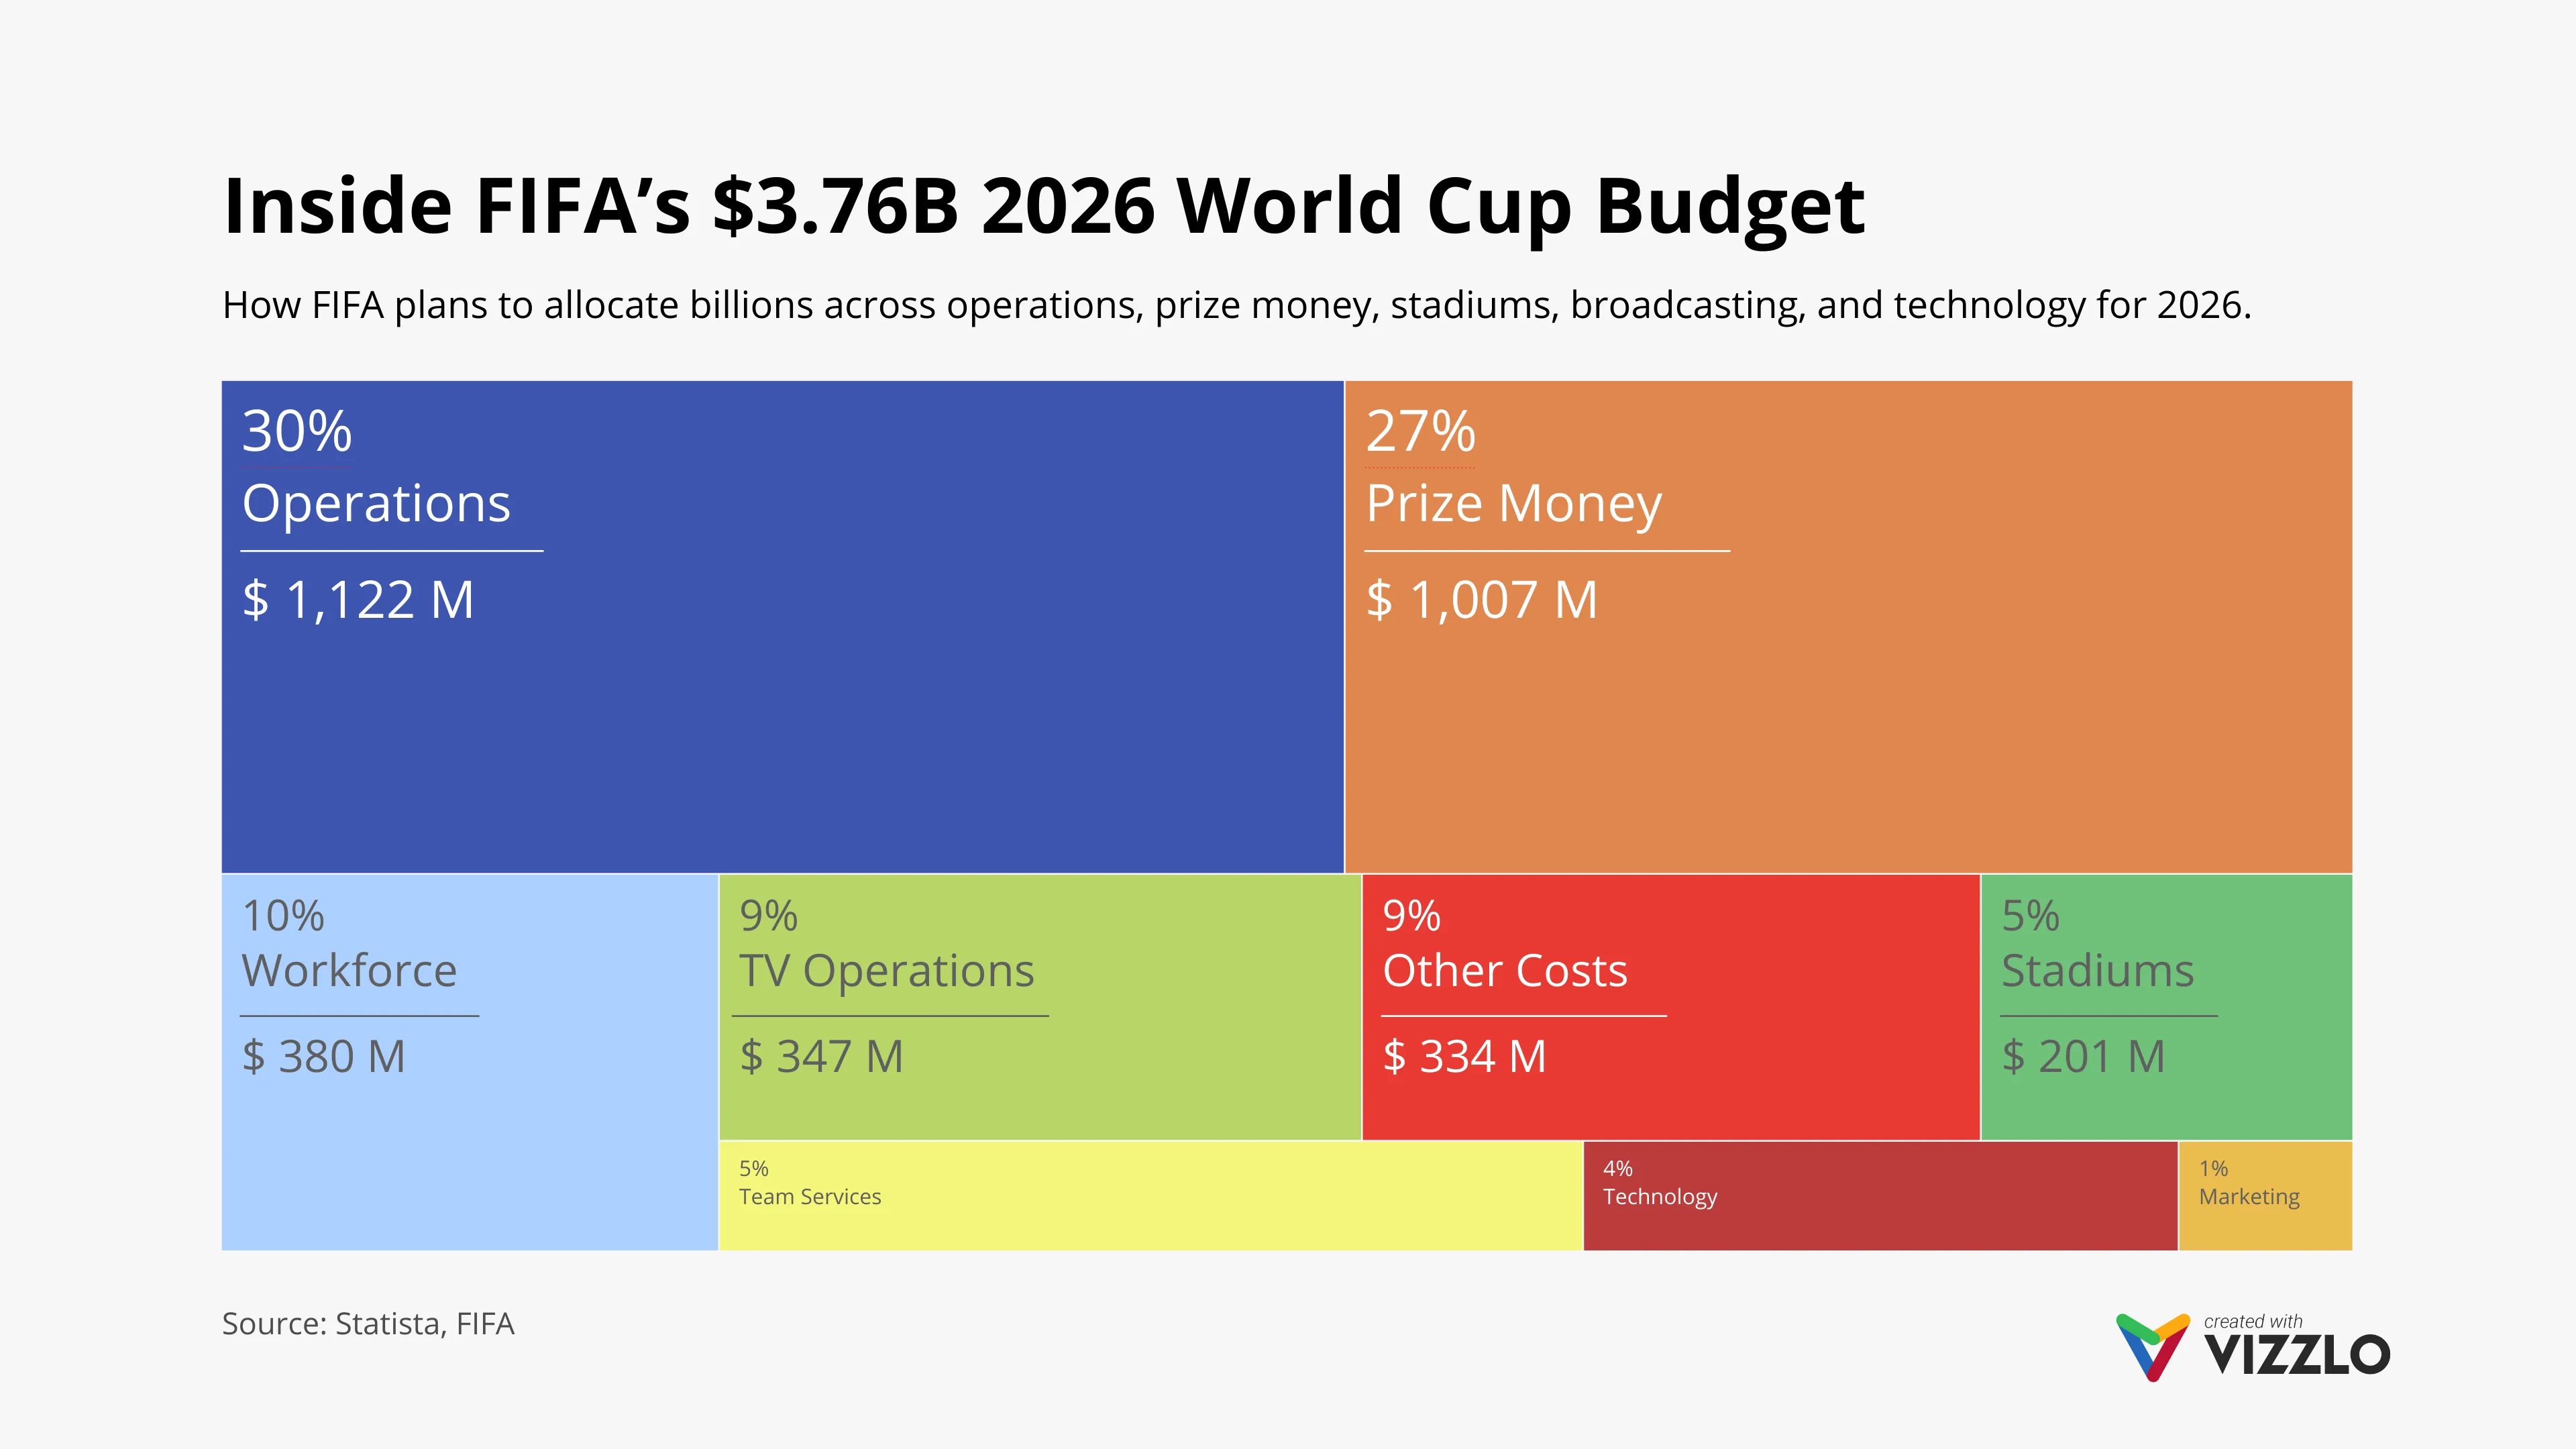
This treemap visualization breaks down FIFA’s estimated $3.76 billion investment for the 2026 FIFA World Cup across major spending categories, including operations, prize money, broadcasting, workforce, stadiums, technology, and marketing. It highlights how the largest portions of the budget are allocated to operational expenses and tournament prize distributions, offering a clear view of FIFA’s financial priorities ahead of the event.
The chart uses proportional sizing and color-coded categories to make complex budget allocations easy to compare at a glance. Large blocks emphasize the scale of operational and prize-related spending, while smaller segments reveal supporting investments such as team services, ICT infrastructure, and marketing rights delivery.
A strong example for presentations, sports business analysis, financial reporting, and data storytelling. Particularly useful for visualizing budget distribution, event planning costs, sponsorship discussions, and large-scale investment strategies with a clean, presentation-ready design.
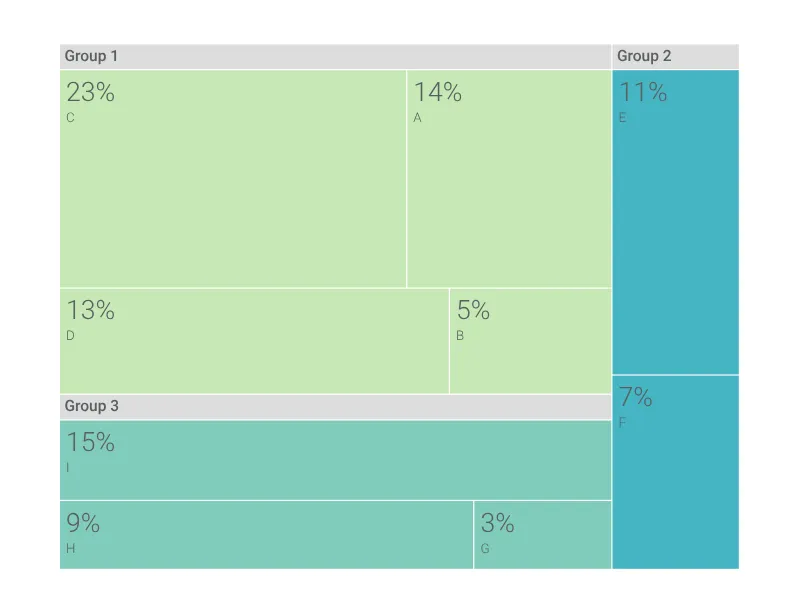
Dies ist ein Beispiel für Vizzlos "Treemap"
Ein Treemap-Diagramm ist oft die bessere Wahl gegenüber einem Kreisdiagramm. Erstellen Sie mühelos ein anspruchsvolles.