Chart Vizzard
Vizzlo's AI-based chart generatorCreate your Treemap in seconds
A treemap chart is often a better choice than a pie chart. Create a sophisticated one with ease.

Create your chart in 3 simple steps
- Create new Treemap
- Add your data
- Export or share
Why Vizzlo?
- Create professional charts in seconds
- Fully customizable, no design skills needed
- Create directly in PowerPoint & Google Slides
What is a treemap?
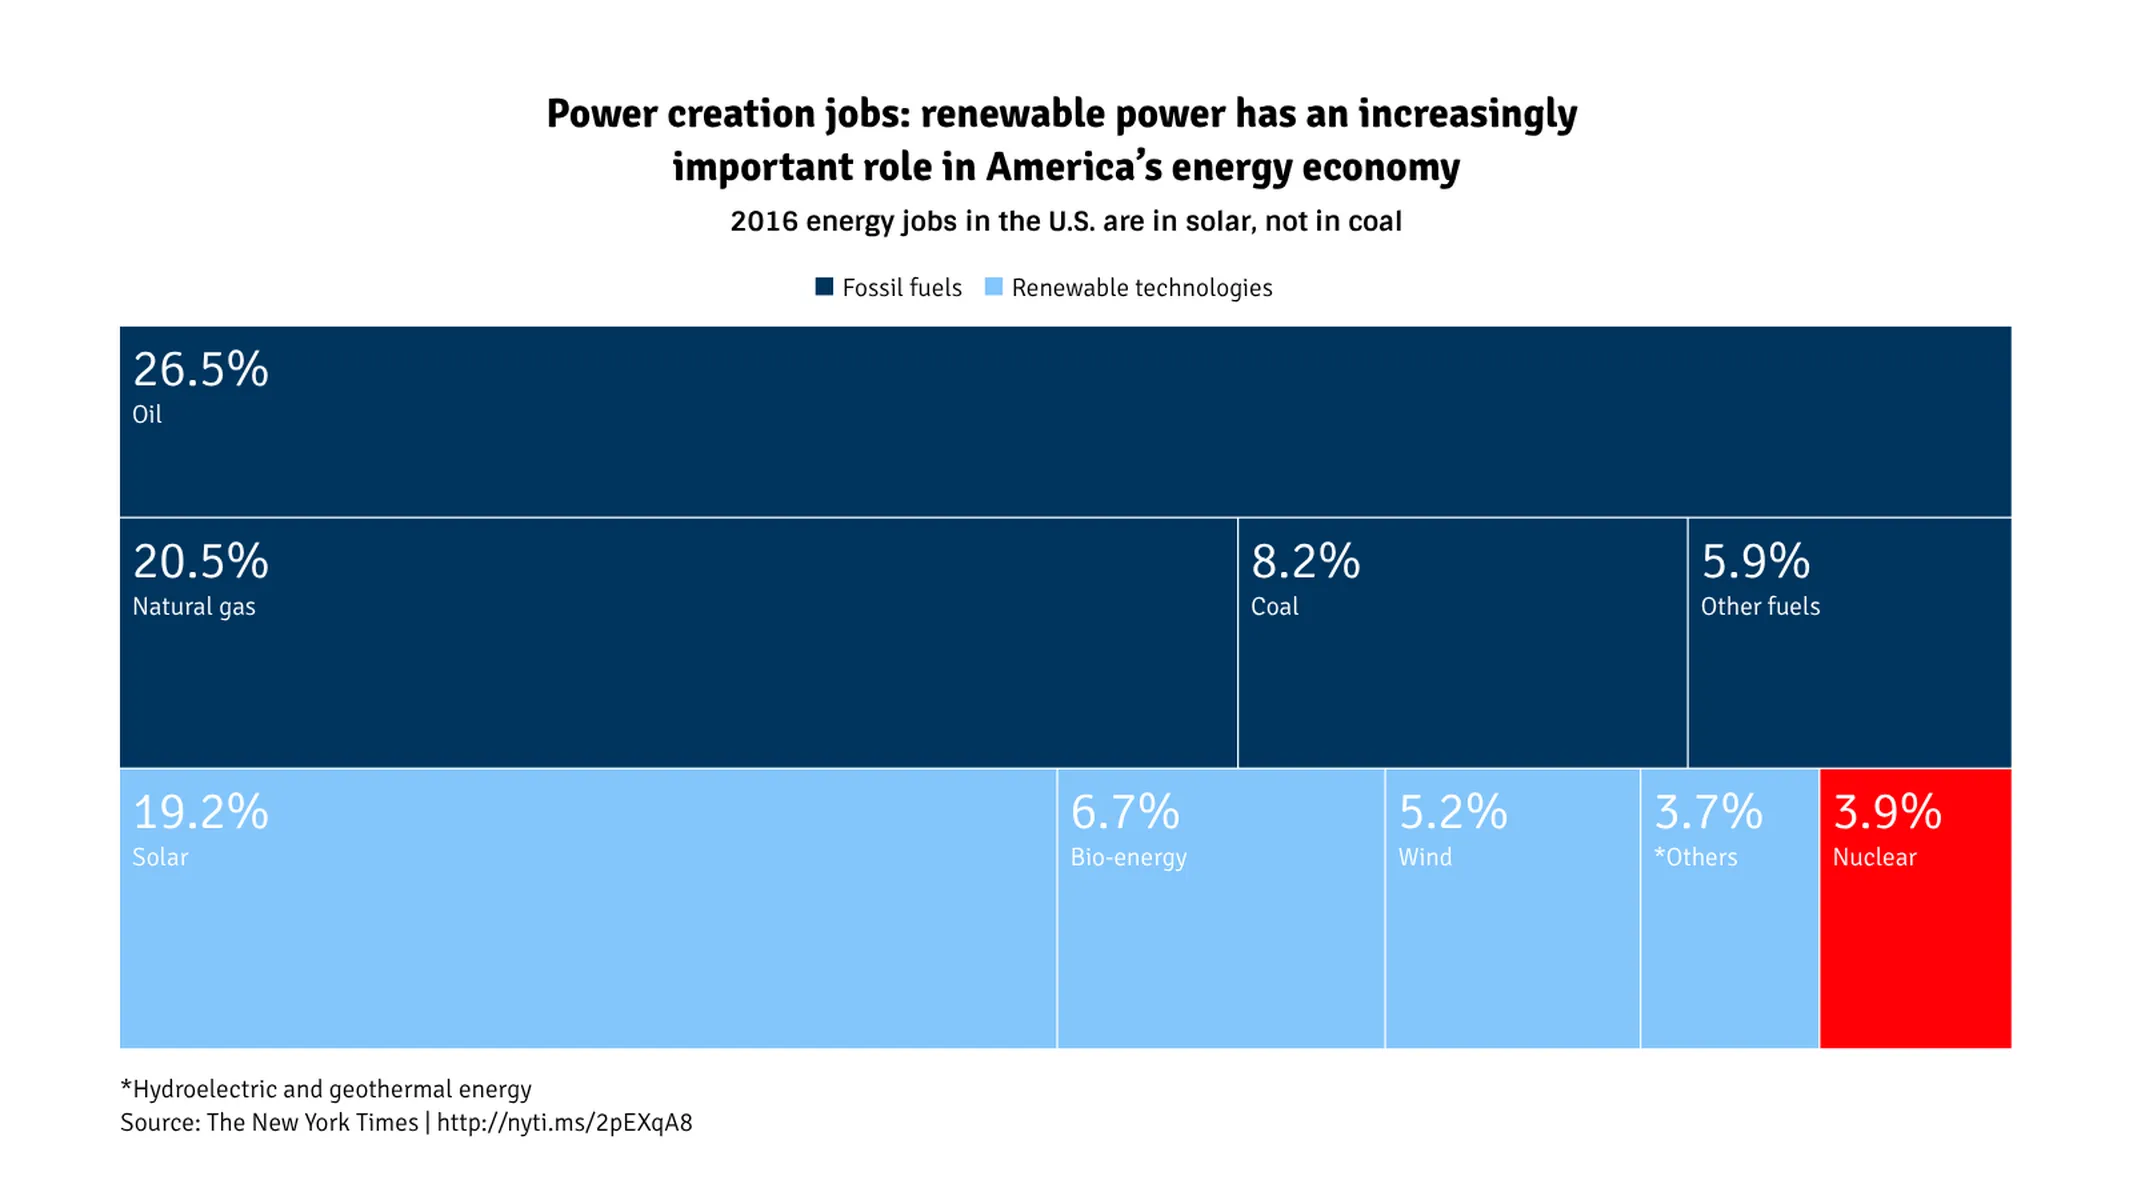
A treemap displays hierarchical data through nested rectangles that represent the composition of groups proportionally, making part-to-whole relationships evident.
In a treemap, the total rectangular area corresponds to 100%. Parent groups are defined by colors and labels, and their areas correspond to the total area of the subordinated smaller segments, i.e., the subcategories.
How to make a treemap with Vizzlo?
Create a colorful treemap to compare proportions among hierarchical data with ease:
- On the tab “DATA” of the sidebar, click on the button “GROUPS” to set the name and the color for your parent groups.
- Click on “EDIT CHART IN SPREADSHEET” to copy and paste your data into it. If necessary, adjust the number format (wheel icon) to match Vizzlo’s spreadsheet with your source.
- Click on any segment to edit it or change its color.
- Play with the layout settings on the tab “APPEARANCE” to choose the most efficient design for the representation of your data and increase the readability.
Pro tip: Hide the values to let the sizes of the parts/proportions speak for themselves. Or leave this option enabled to facilitate reading.
Treemap maker: key features
- Hierarchical structure
- Custom number formats and colors
- Adjustable layout
- Different labeling options for parent groups
Treemap: What's new?
These chart types now all support adding custom formatting to individual value labels.
There is now the option to hide all data labels, and we also streamlined the user interface.
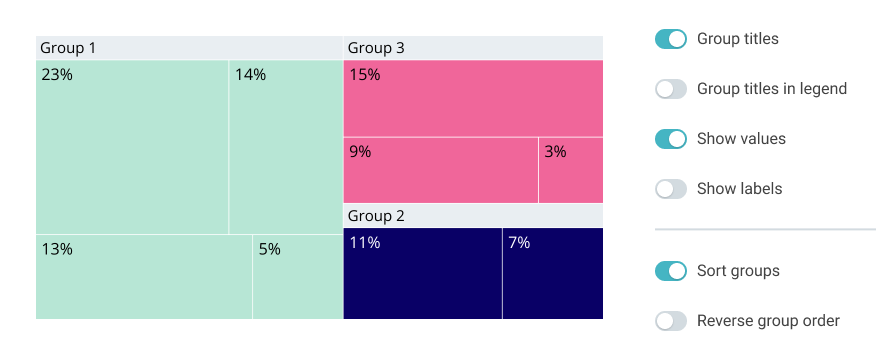
The chart features now sorting and reversing of groups.
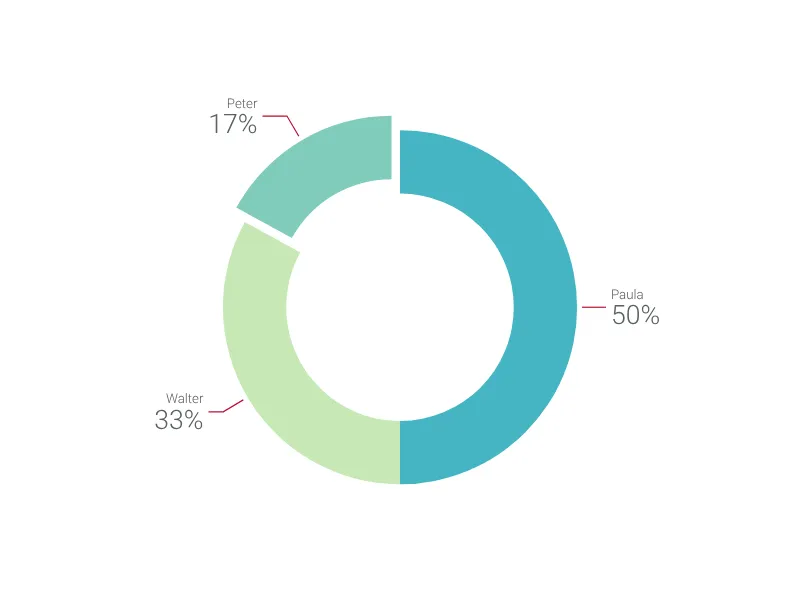
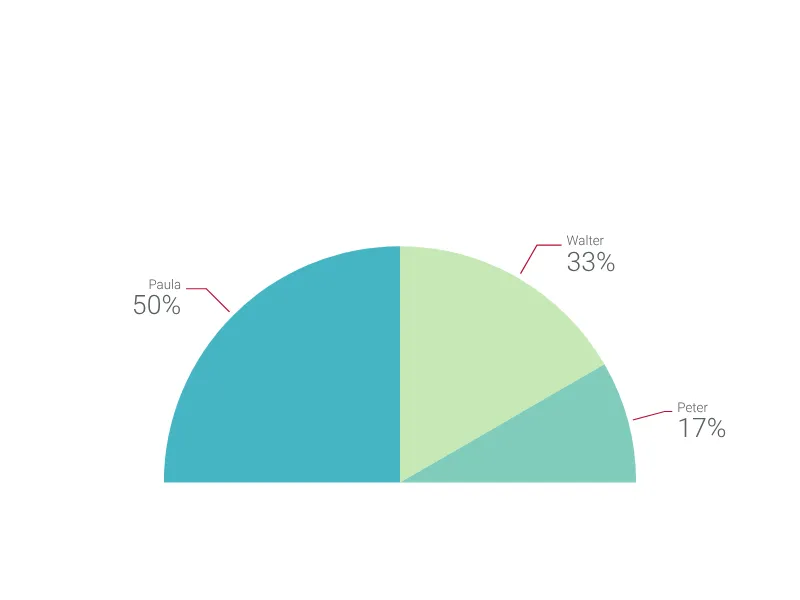
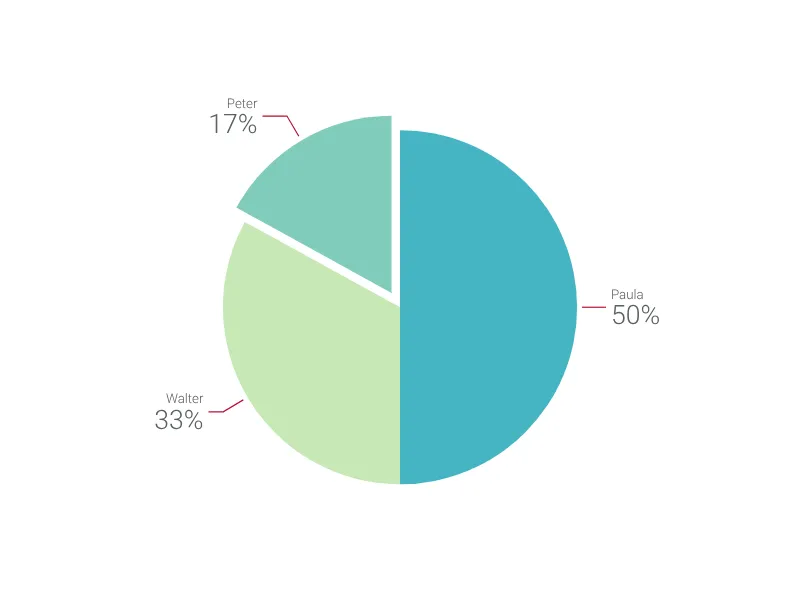
Treemap Alternatives
Use Cases
Line & Area chartsEnhance your productivity
Create a Treemap directly in the tools you love

Create a Treemap in PowerPoint with
Vizzlo's add-in

Loved by professionals around the world


Visualizations your audience won’t forget
Convey abstract concepts and data with professionally designed
charts and graphics you can easily edit and customize.