VORSCHAU
Chart Vizzard
Vizzlos KI-basierter Diagramm-GeneratorWhat Happens to Our Trash Plastic?
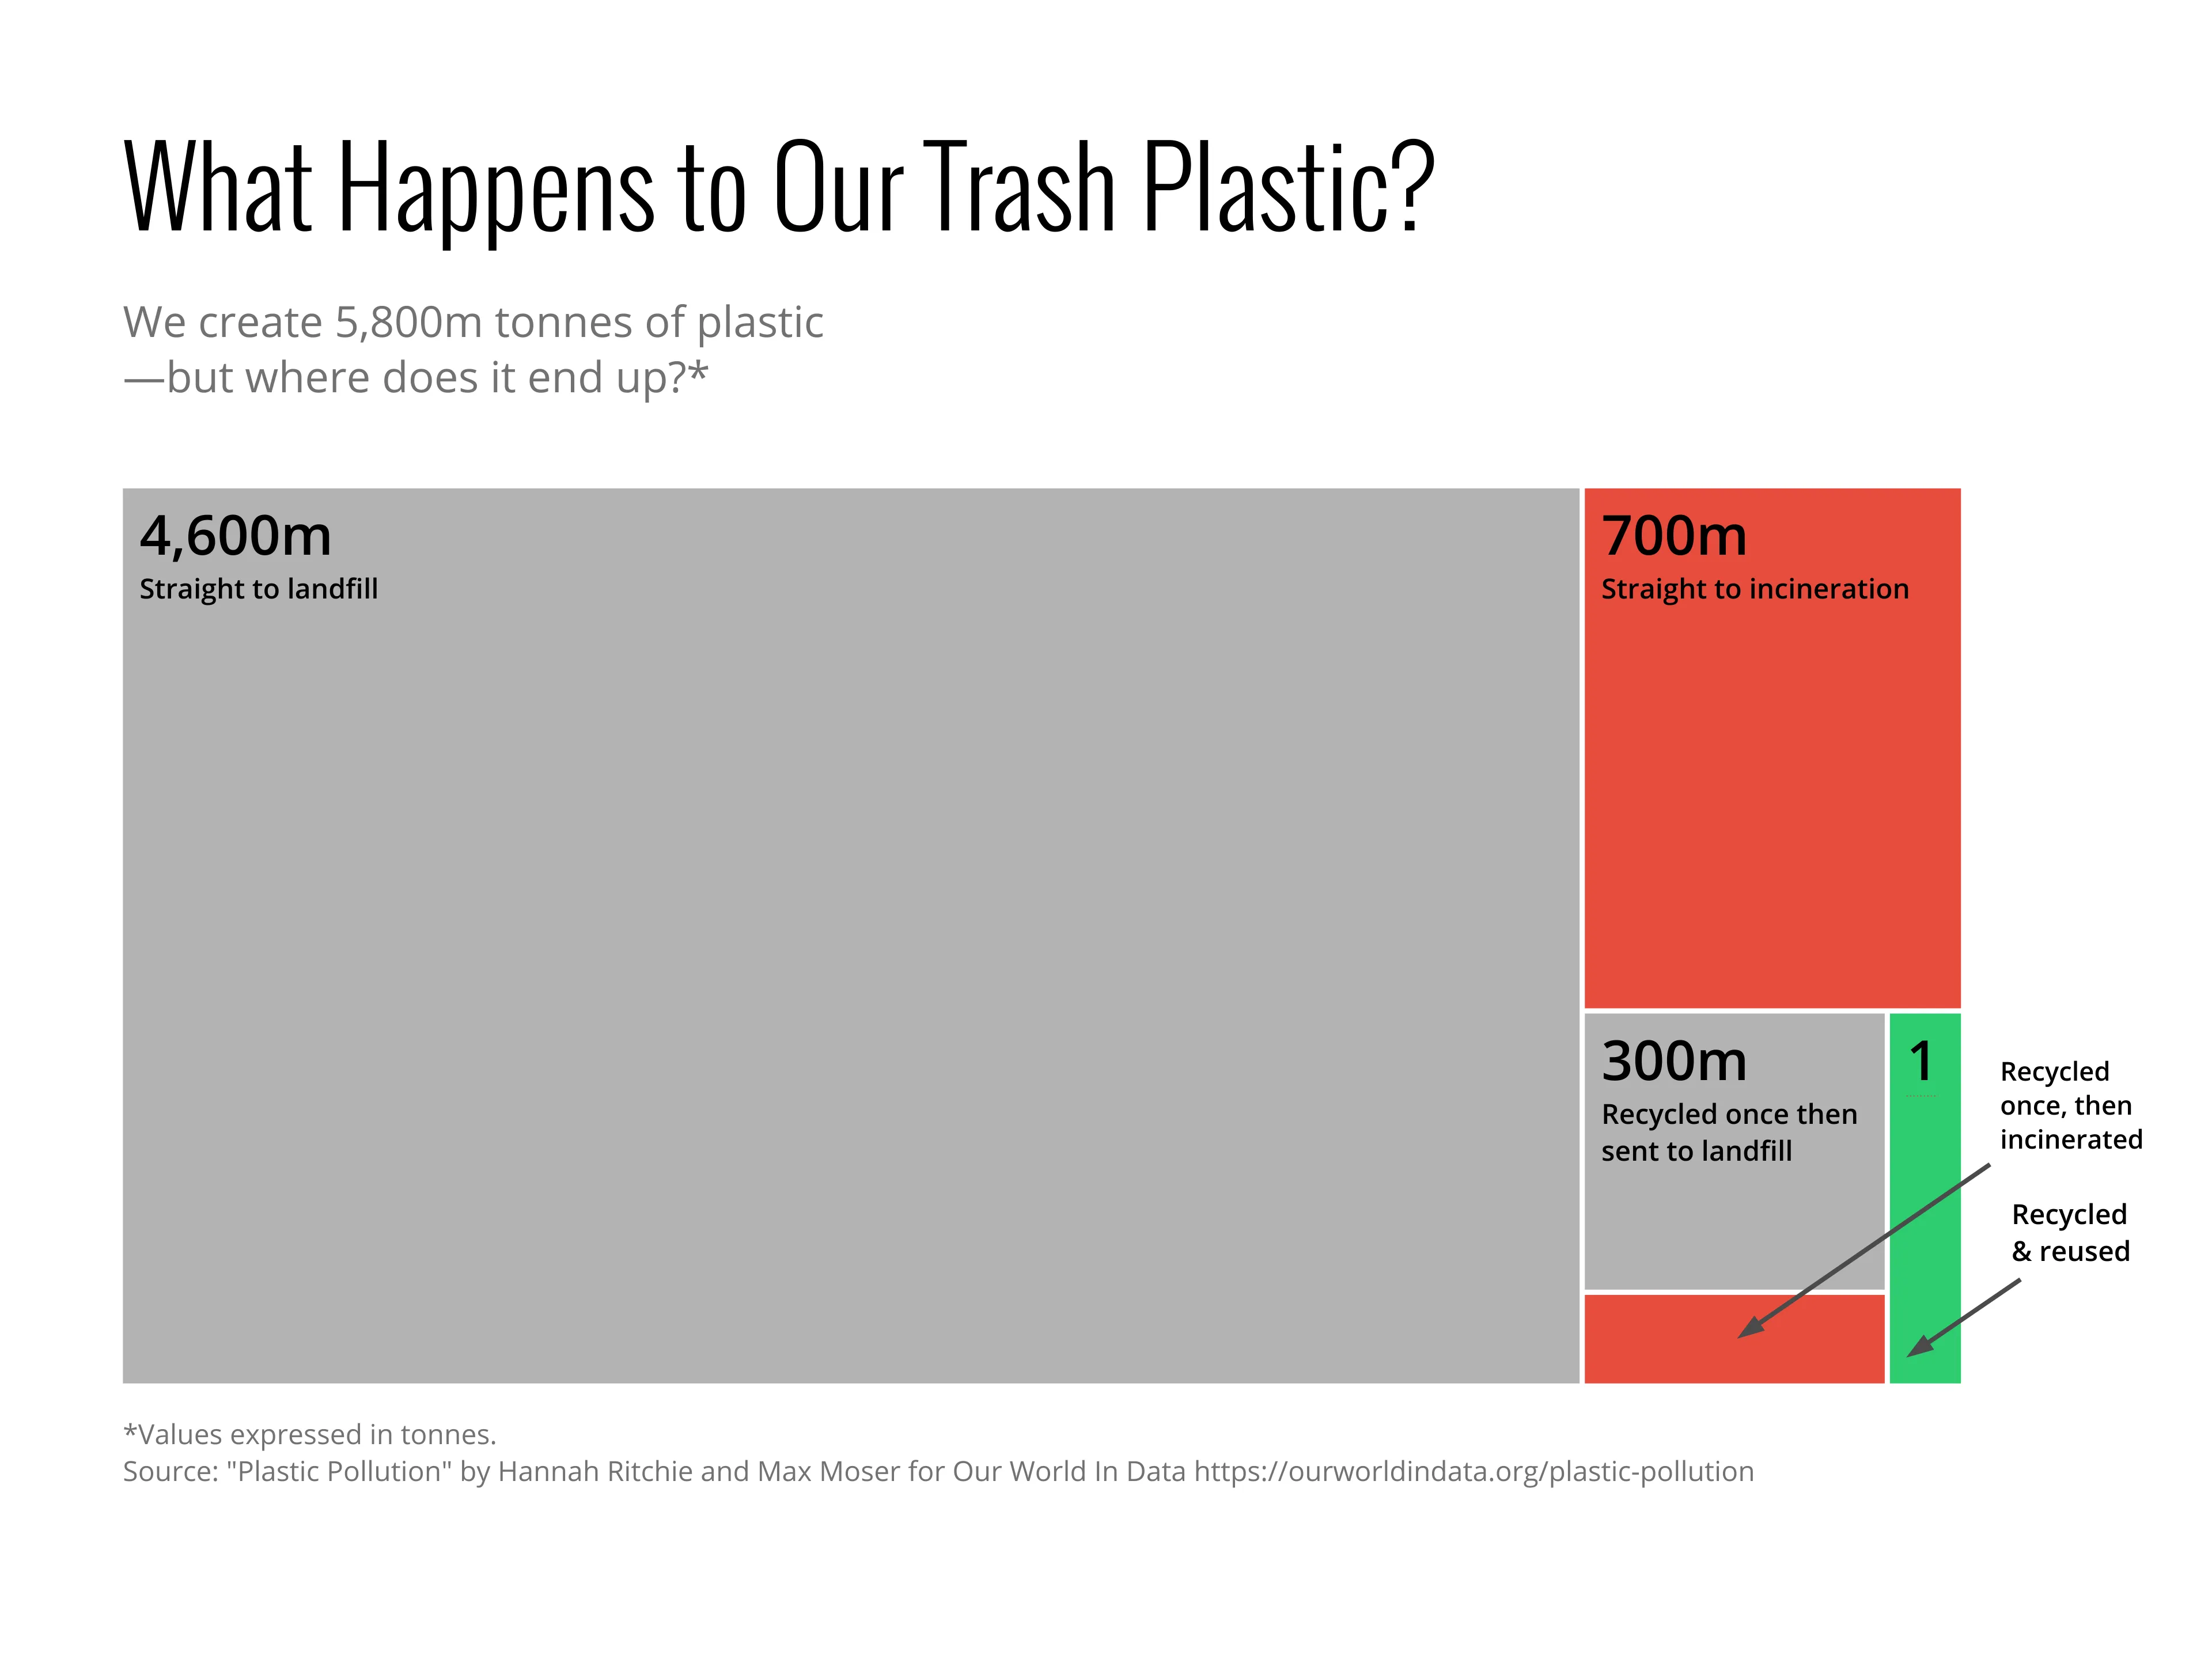
We all know the world is drowning in plastic, and most of us try to recycle as much as we can. However we don’t really know where our trash goes once it leaves our house. This weeks graphic spotlights the fate of discarded plastic worldwide.
In 2015, only 19.5% of it was recycled - still a long way to go if we want to make a difference.
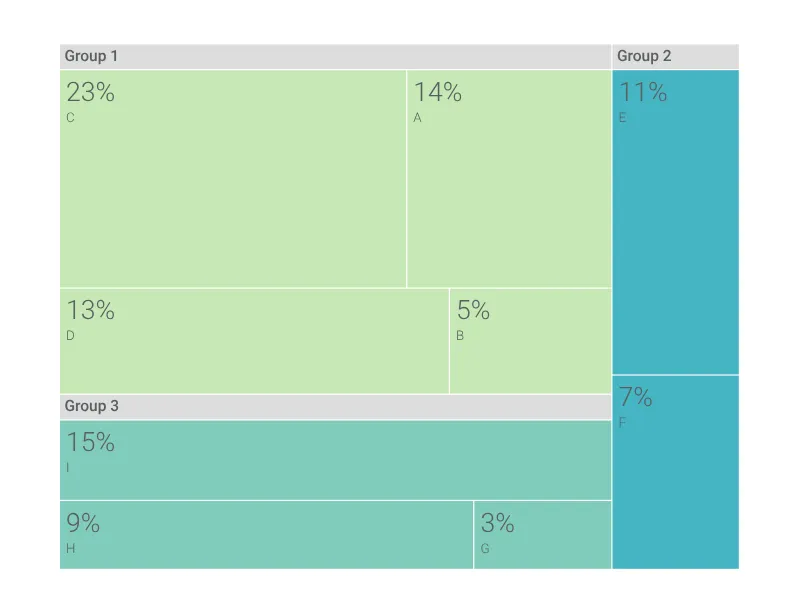
Dies ist ein Beispiel für Vizzlos "Treemap"
Ein Treemap-Diagramm ist oft die bessere Wahl gegenüber einem Kreisdiagramm. Erstellen Sie mühelos ein anspruchsvolles.