VORSCHAU
Chart Vizzard
Vizzlos KI-basierter Diagramm-GeneratorThe impact of the Covid-19 crisis on clean energy progress
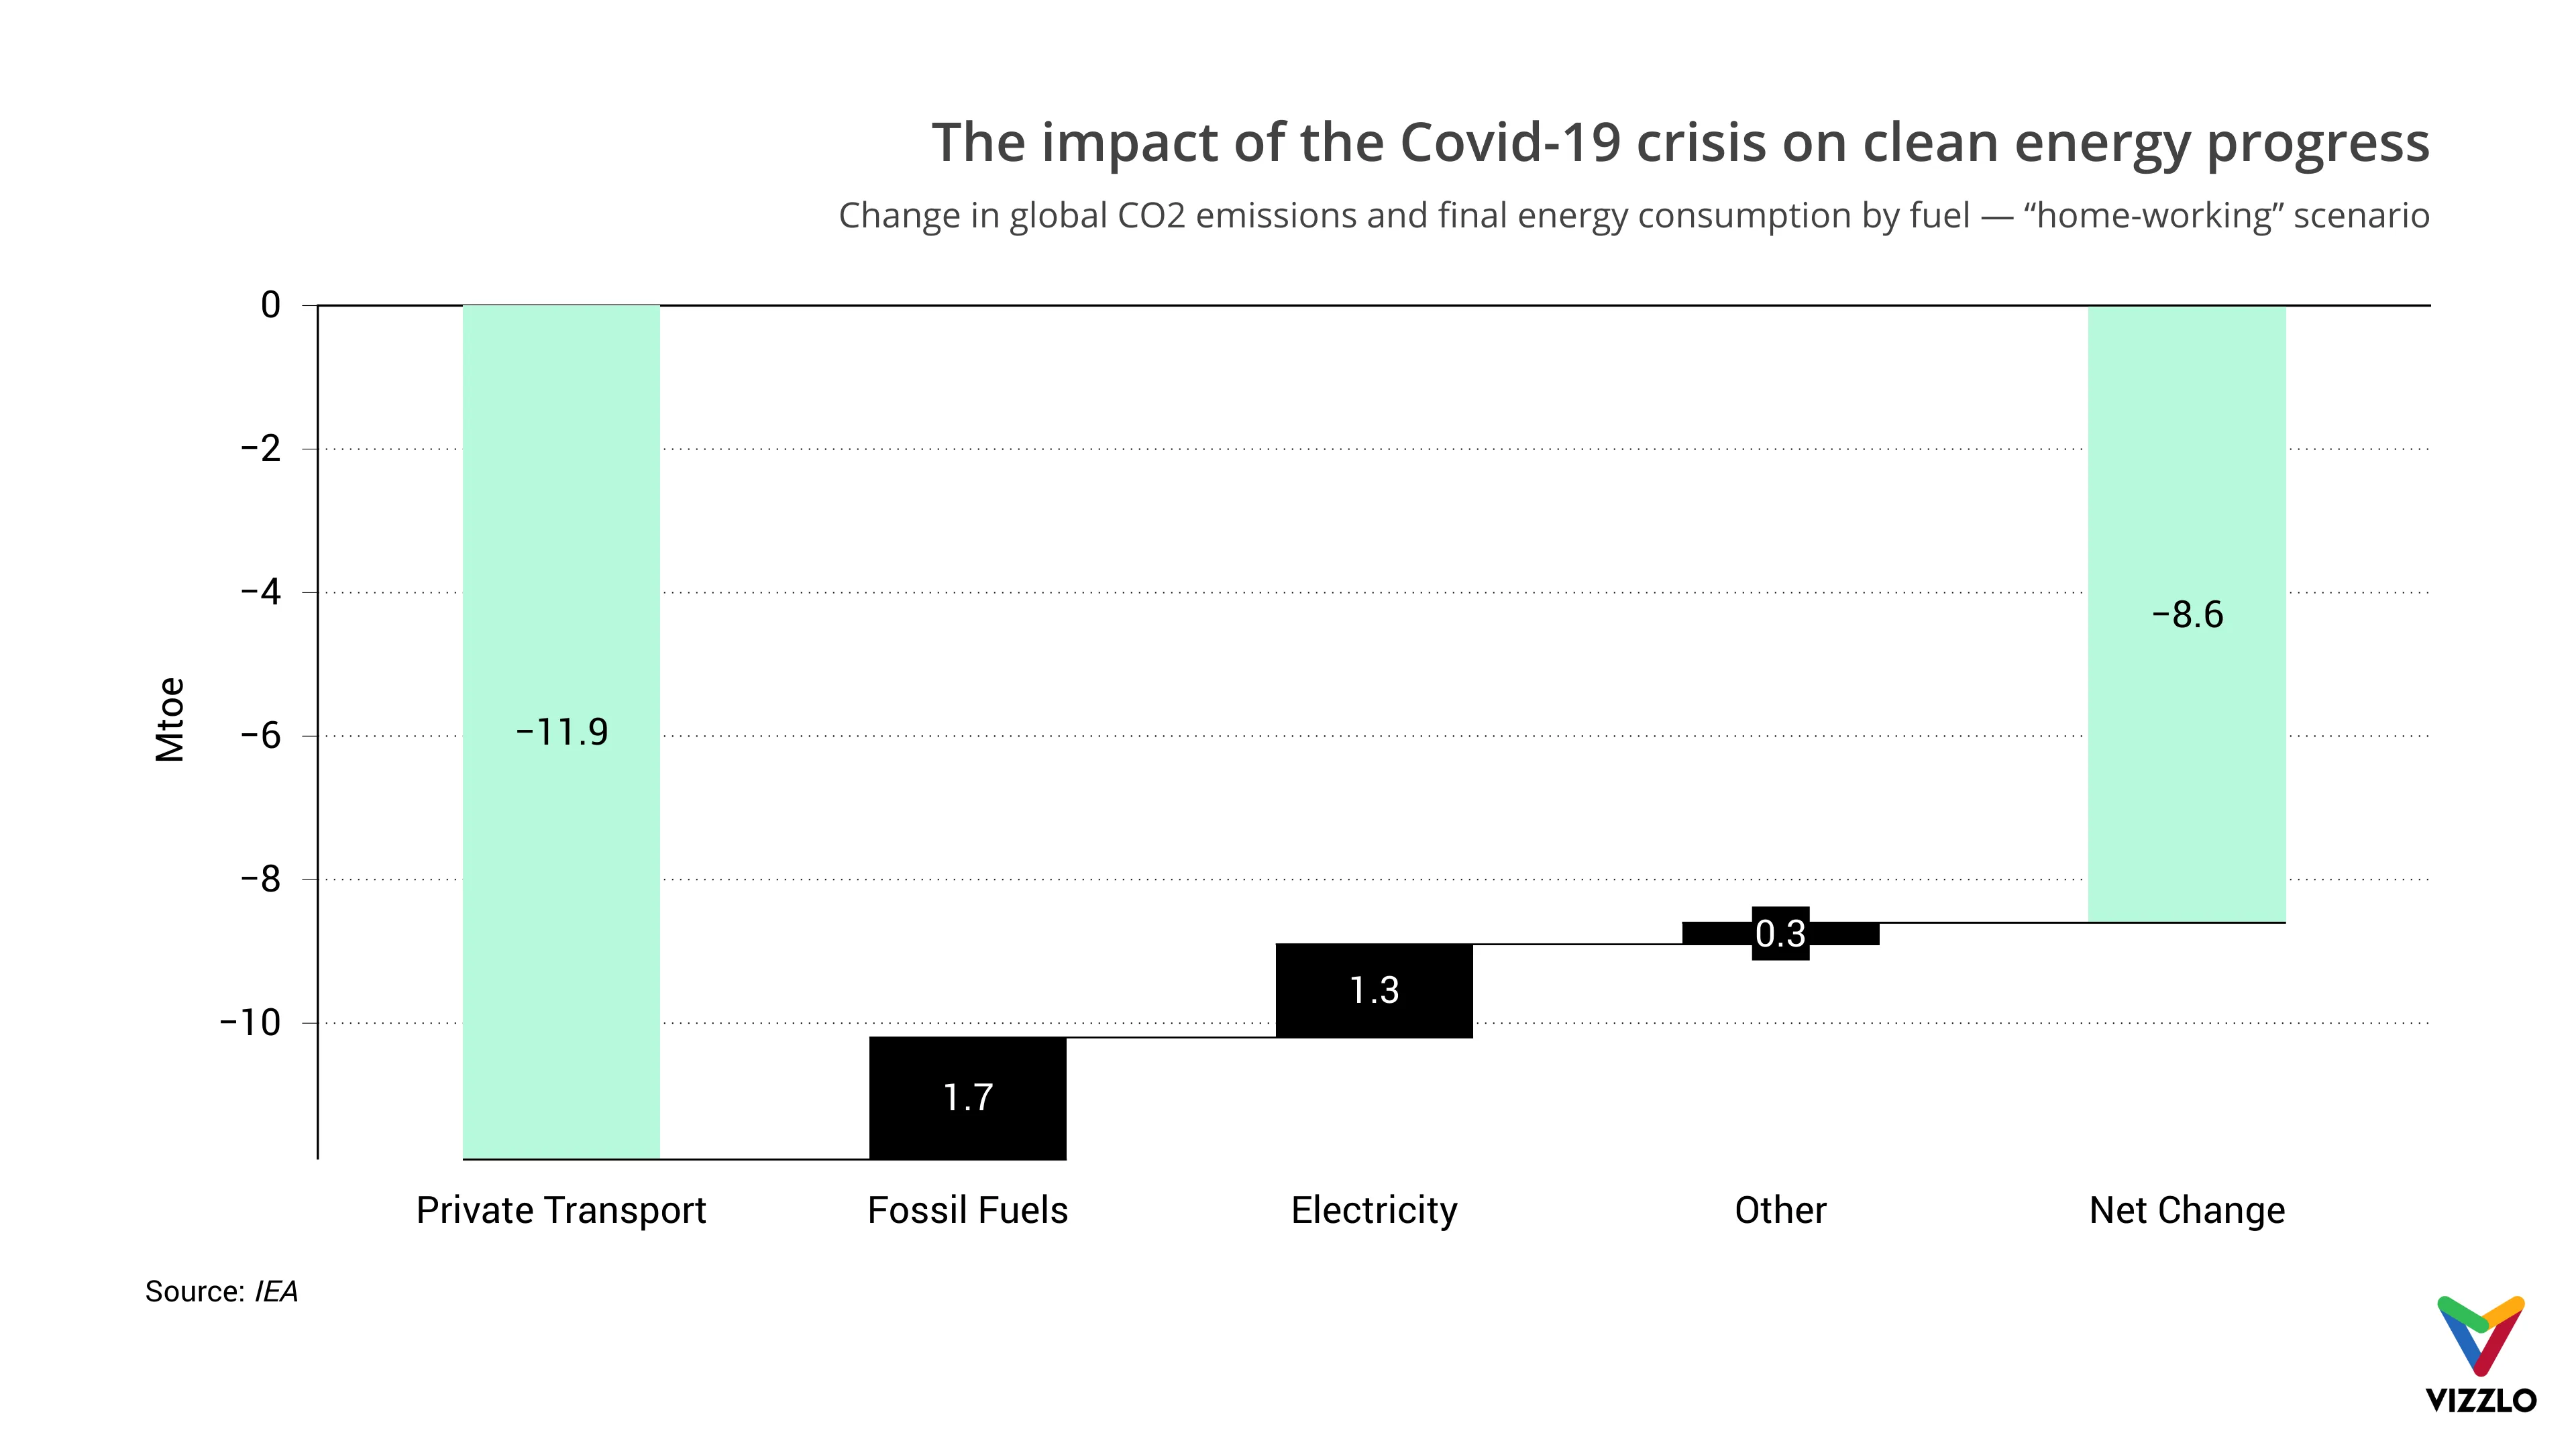
Government lockdowns have prompted changes in behavior. Perhaps in no other energy demand sector are the impacts of the COVID-19 response more readily apparent than in transport.
More people are teleworking, business and leisure travel has been sharply reduced, and consumers have shifted more of their purchases online. These changes may have long-term impacts on clean energy progress, depending on whether positive aspects associated with the behaviors can be sustained after the crisis ends.
Source: iea.org
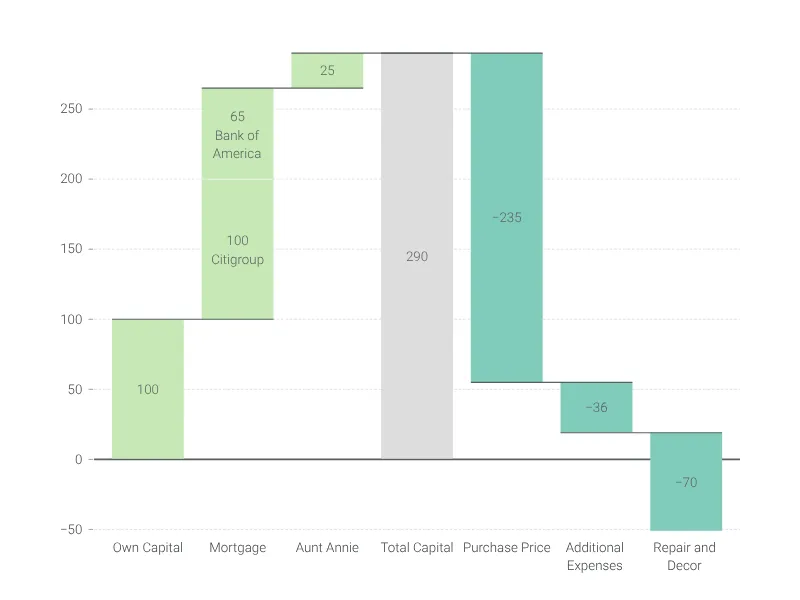
Dies ist ein Beispiel für Vizzlos "Wasserfalldiagramm"
Säulendiagramm, mit dem die Veränderung eines Anfangswertes durch eine Serie von weiteren Werten visualisiert werden kann.