Chart Vizzard
Vizzlos KI-basierter Diagramm-GeneratorThe most intense tropical storms in the Atlantic basin
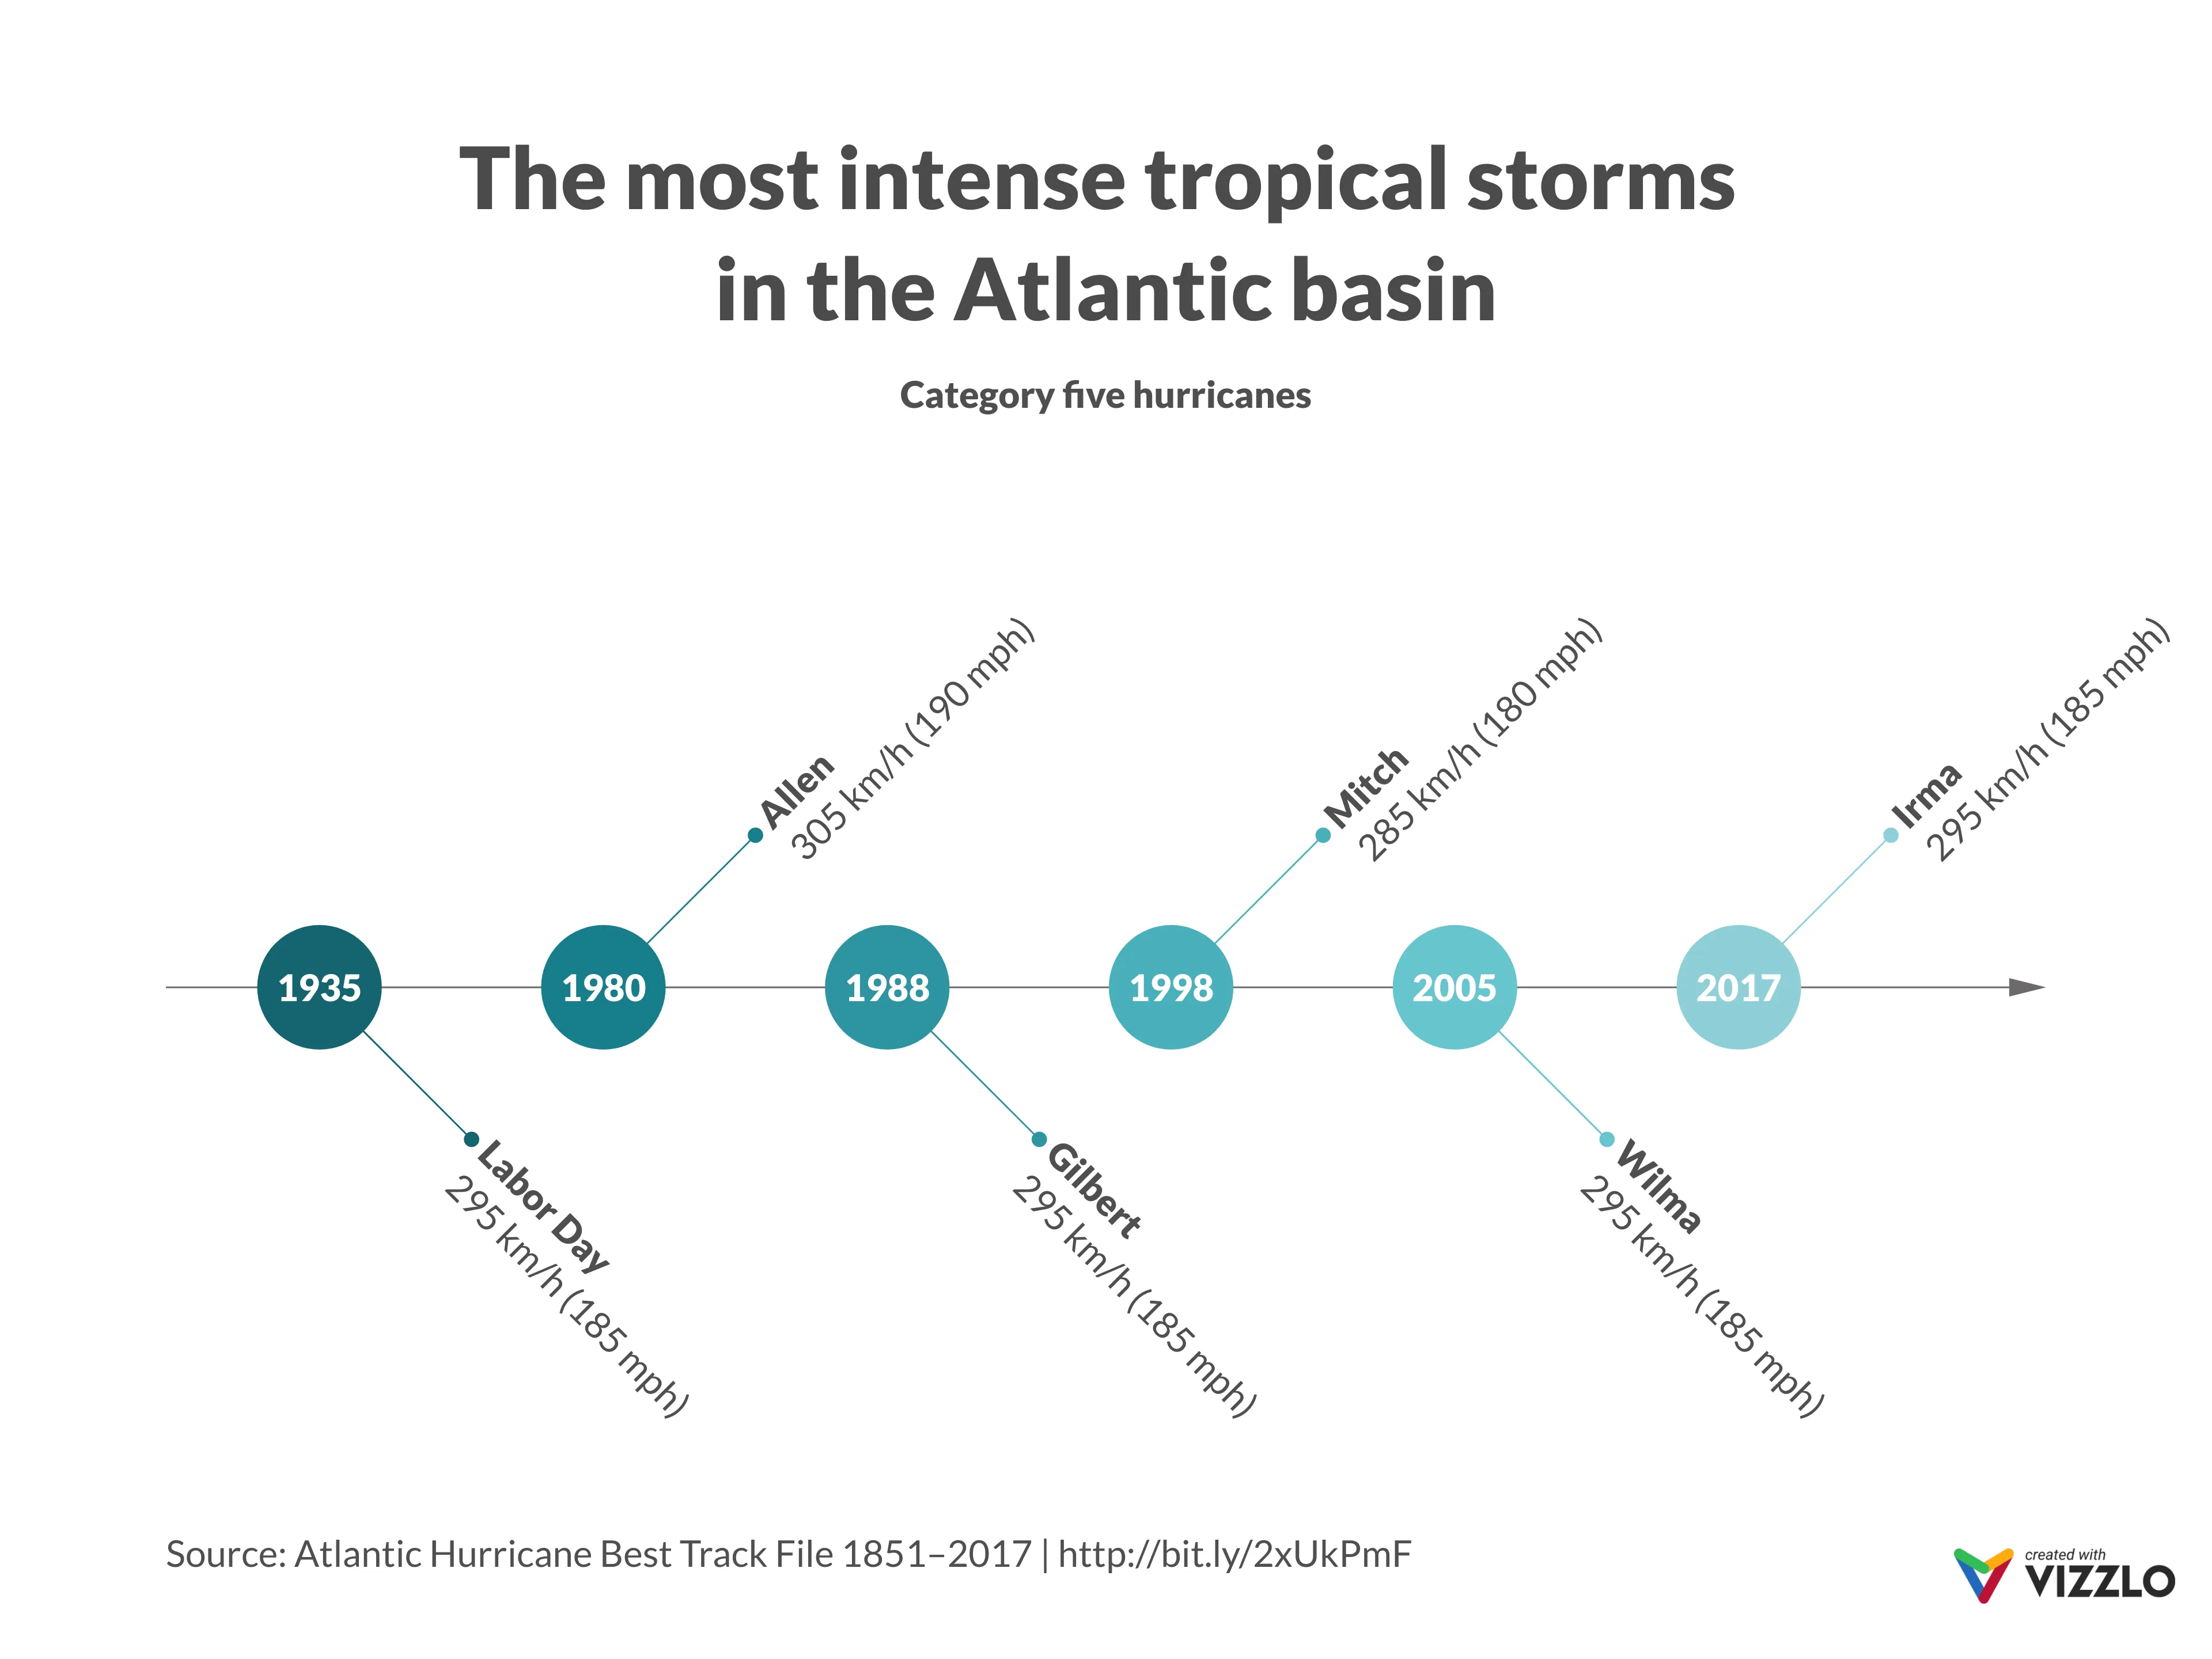
The 2017 Atlantic hurricane season was deadly and devastating—it featured multiple category 5 hurricanes (with two of them making landfall at this intensity). Hurricanes Harvey, Irma, and Maria figure among the strongest ever recorded in history. It officially began on June 1, ended on November 30, and left [seven Caribbean islands] (https://www.vox.com/science-and-health/2017/9/26/16367410/hurricane-maria-2017-puerto-rico-caribbean-barbuda-dominica-virgin-islands-cuba-st-martin) struggling to recover after the destruction caused by the storms.
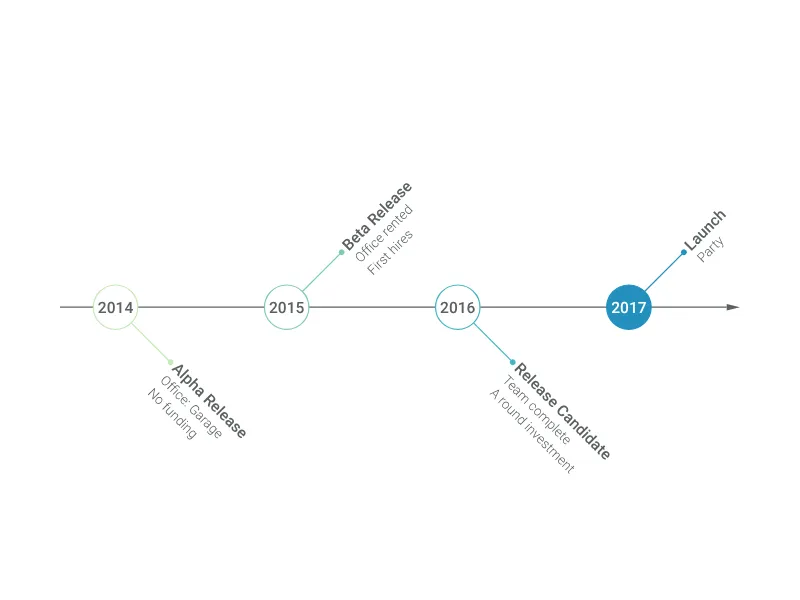
Dies ist ein Beispiel für Vizzlos "Fischgräten-Zeitachse"
Einfach zu erstellen – dieses Zeitachsendiagramm macht Ihre Projektpräsentationen und Berichte überzeugender.
Zeitbasierte Diagramme Prozess- & Strukturdiagramme Zeitleisten & Roadmaps