Chart Vizzard
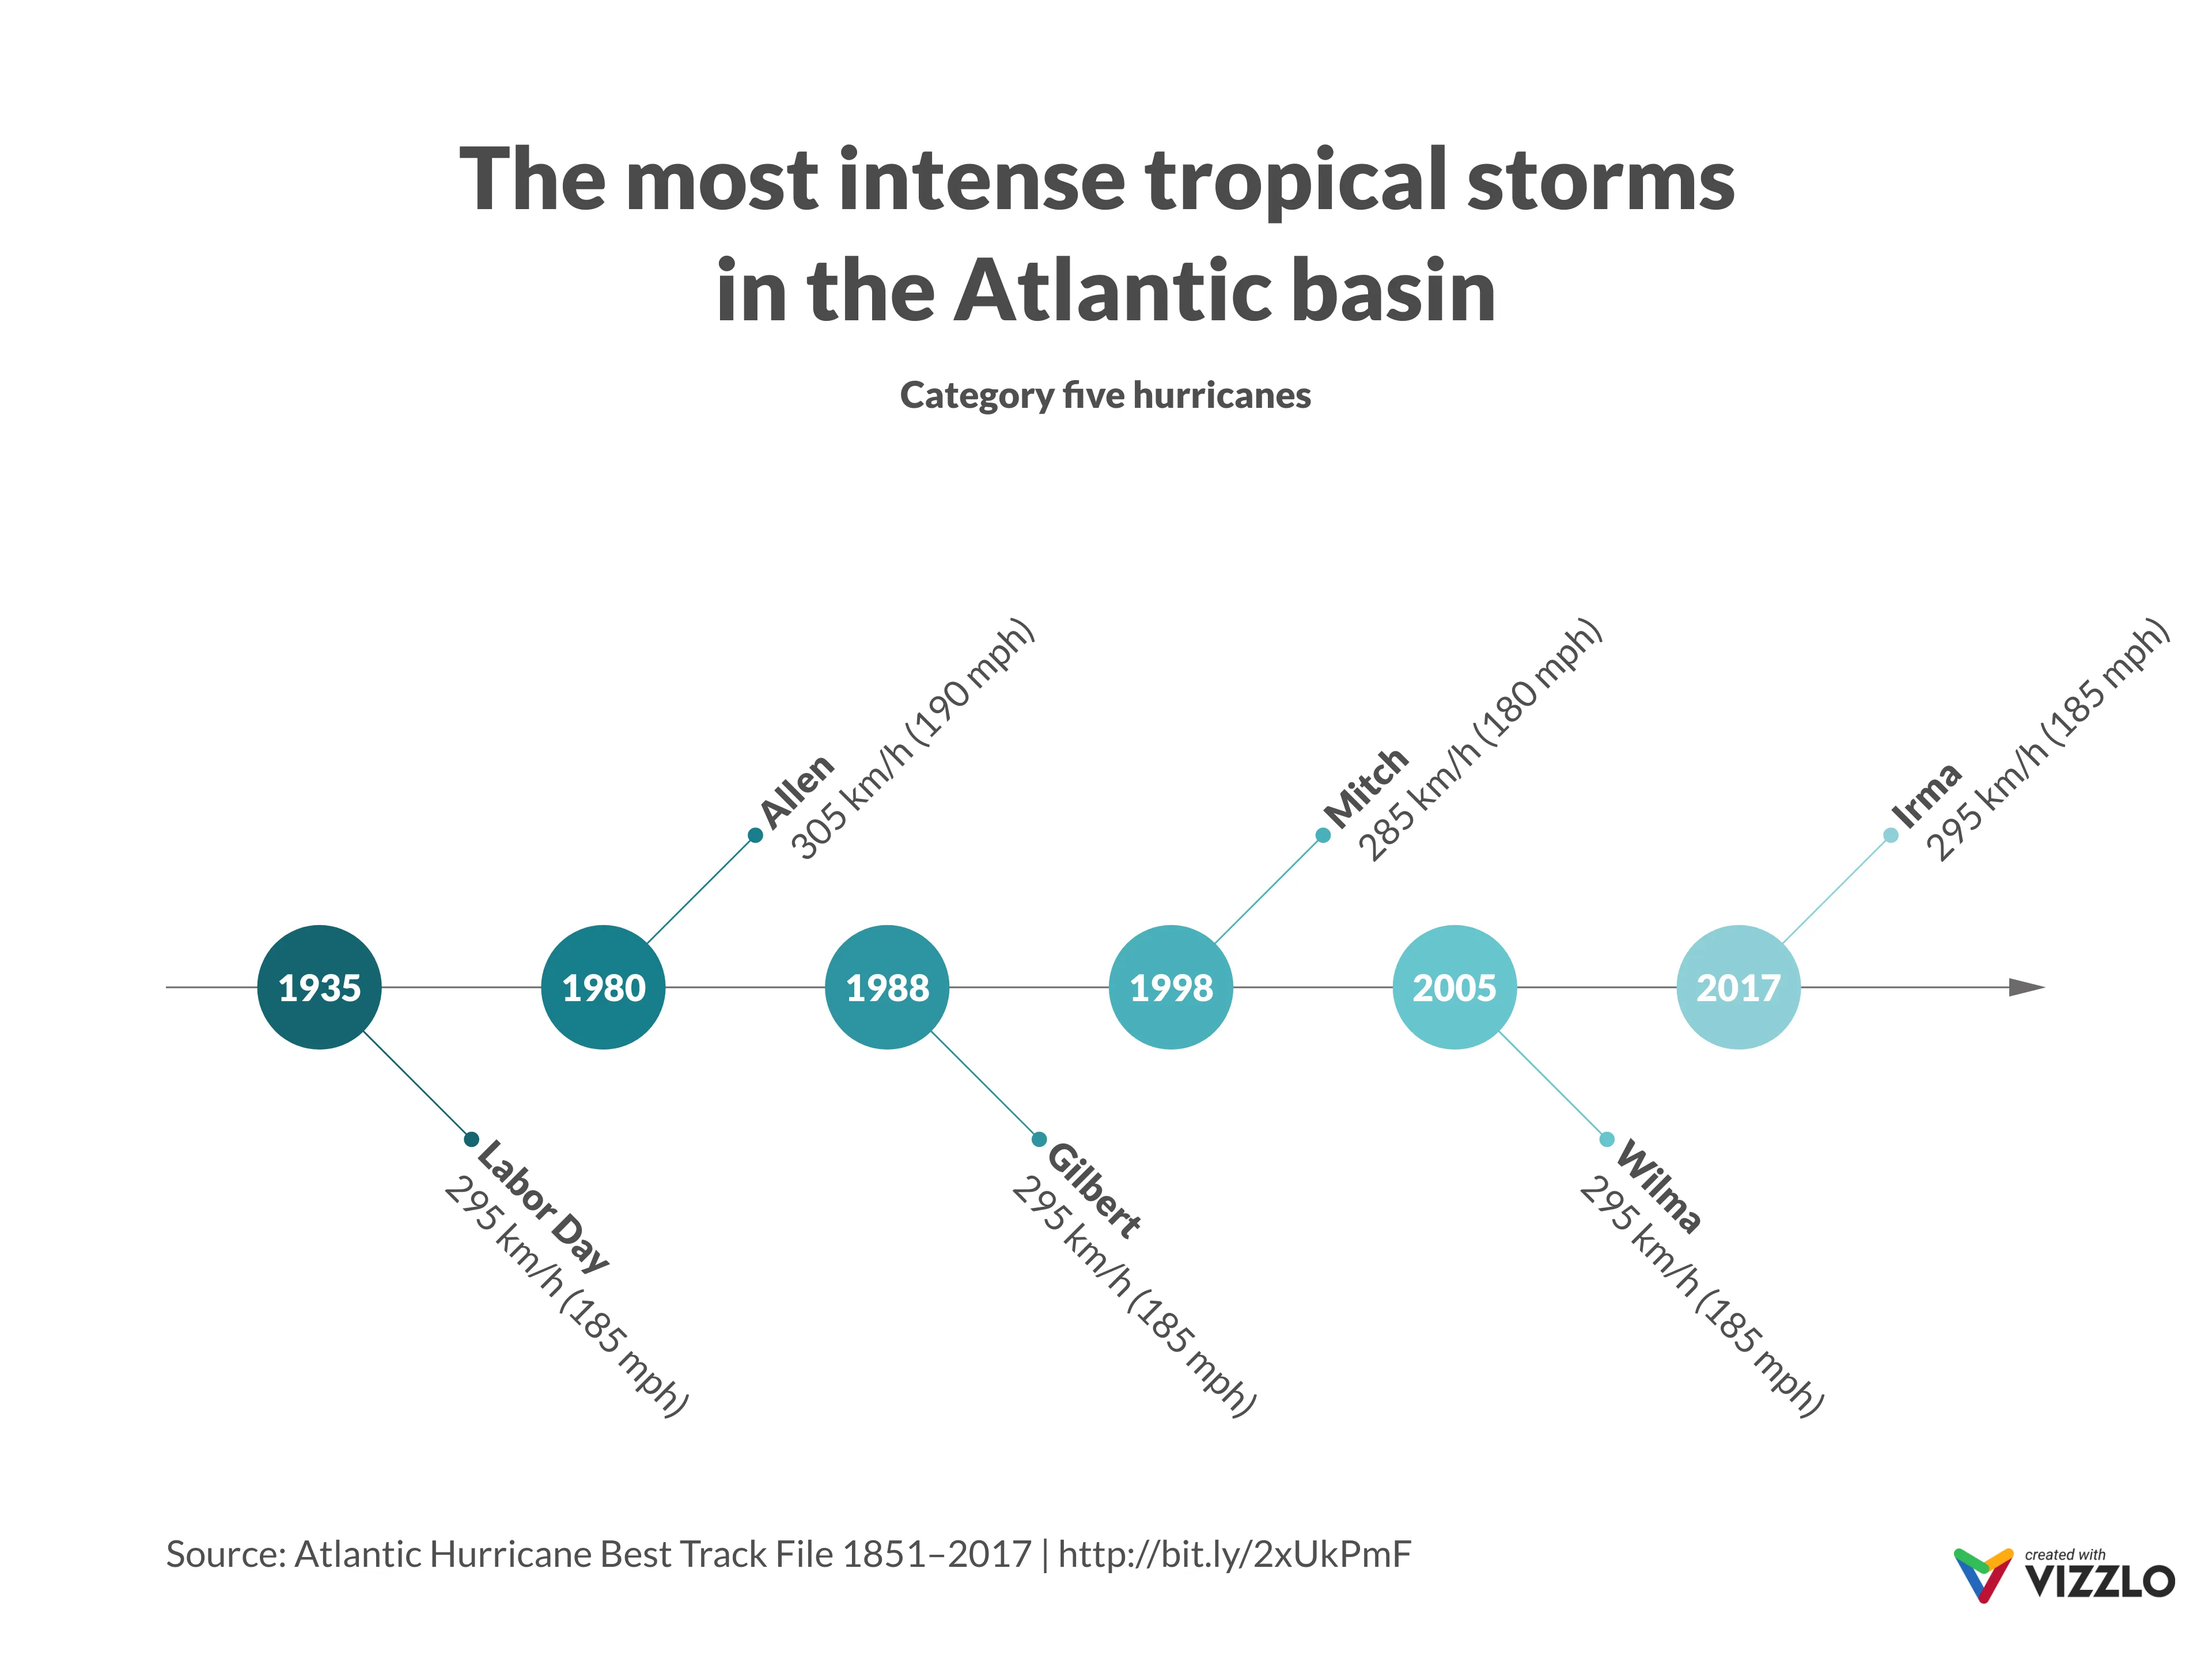
Vizzlo's AI-based chart generatorThe most intense tropical storms in the Atlantic basin

The 2017 Atlantic hurricane season was deadly and devastating—it featured multiple category 5 hurricanes (with two of them making landfall at this intensity). Hurricanes Harvey, Irma, and Maria figure among the strongest ever recorded in history. It officially began on June 1, ended on November 30, and left [seven Caribbean islands] (https://www.vox.com/science-and-health/2017/9/26/16367410/hurricane-maria-2017-puerto-rico-caribbean-barbuda-dominica-virgin-islands-cuba-st-martin) struggling to recover after the destruction caused by the storms.

This is an example of Vizzlo's “Fishbone Timeline”
Easy to create, this timeline chart will make your project presentations and reports more compelling.
Time-based charts Process & Structure diagrams Timelines & Roadmaps