Chart Vizzard
Vizzlos KI-basierter Diagramm-GeneratorConstruction Gantt Chart Template
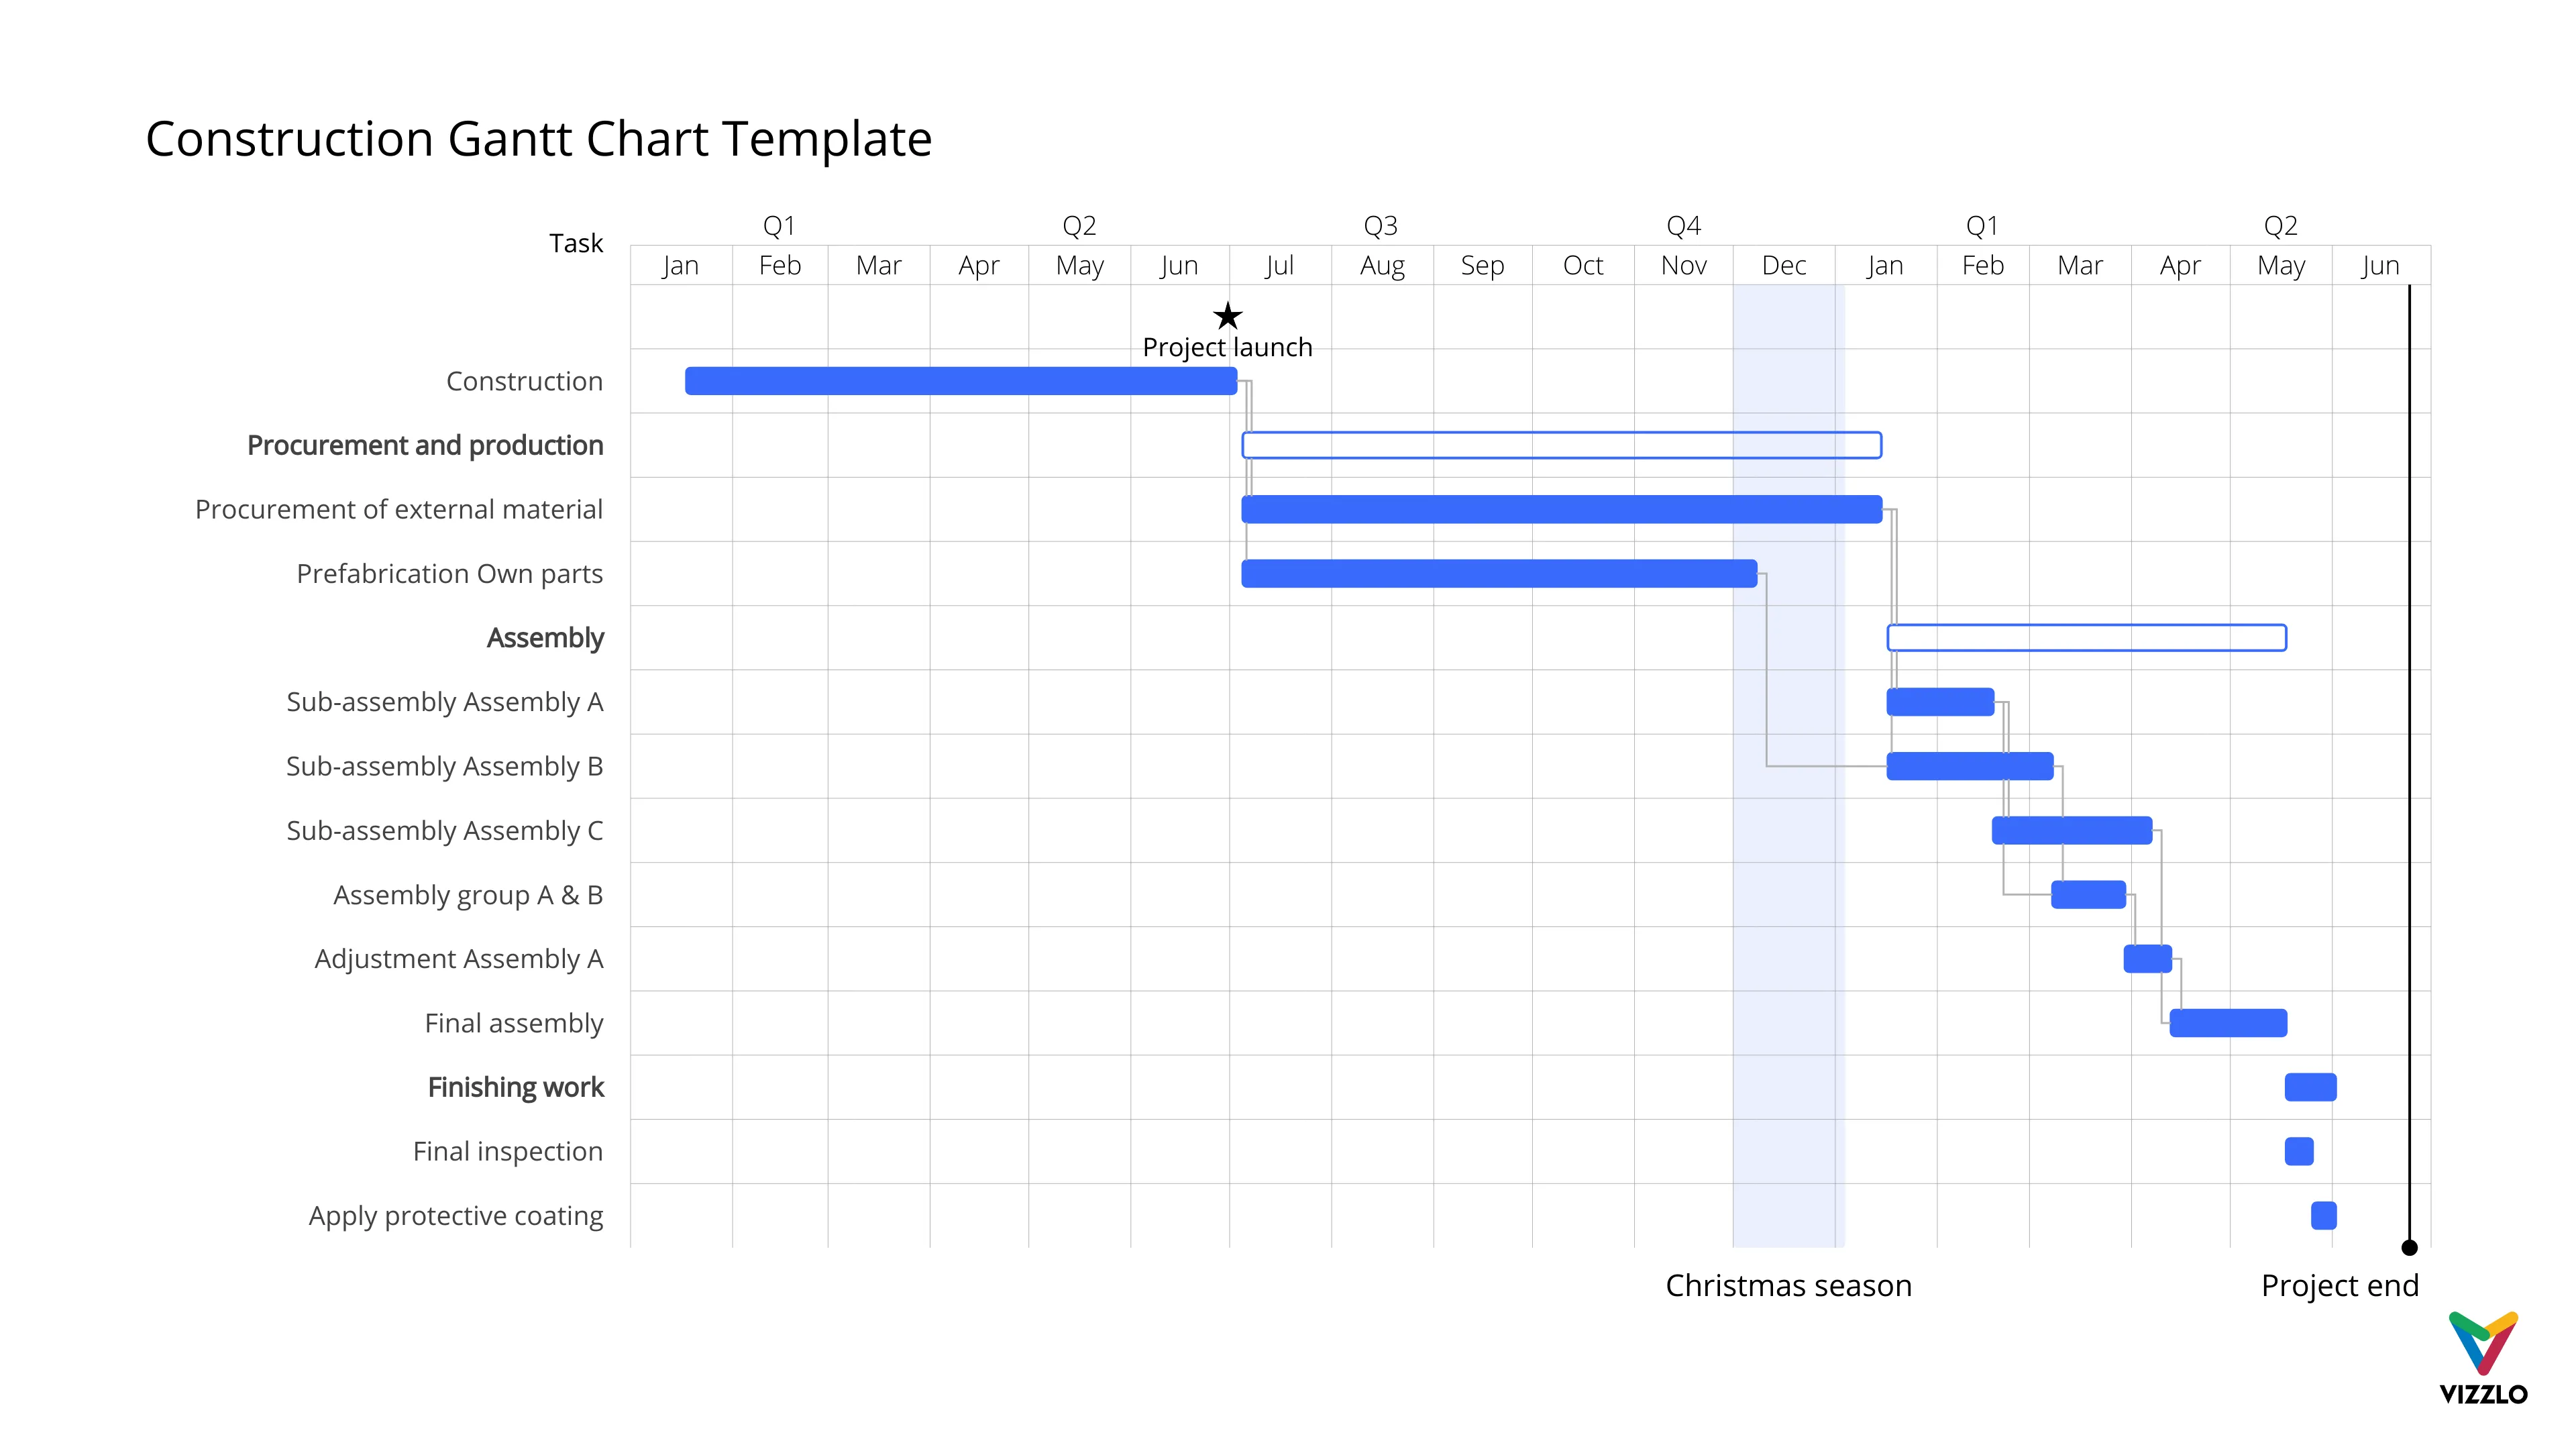
Project management describes a comprehensive organizational and operational concept that enables complex projects to be completed on time, cost-effectively, and with the necessary in high quality. It contains the organization and all tools for planning, coordination, steering and controlling of the intended project.
The Gantt chart, which was designed in 1910 for machine allocation, is nowadays used in project management, among other things, to display schedules in the form of tasks. The aim is the representation and communication of the scheduling of a project.
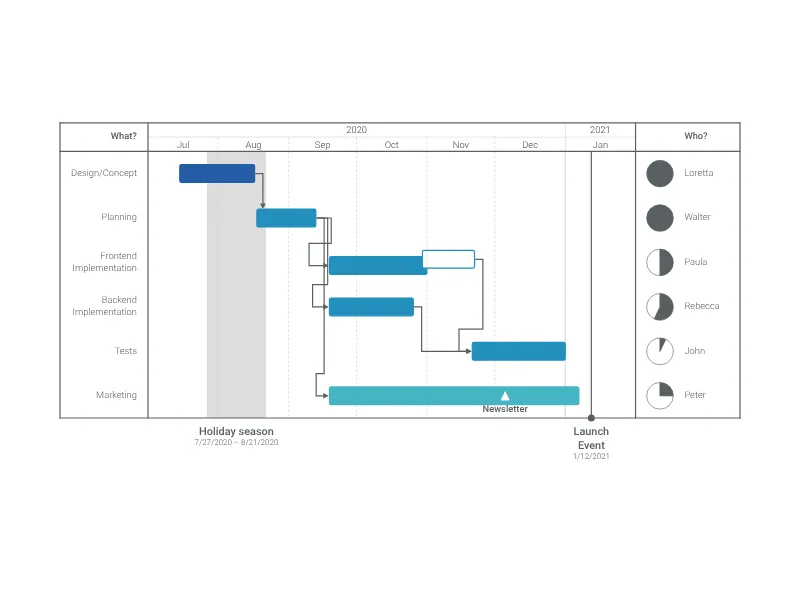
Dies ist ein Beispiel für Vizzlos "Gantt-Diagramm"
Visualisieren Sie Projektzeitpläne und Ihren Fortschritt.
Projektmanagement Zeitbasierte Diagramme Meilenstein-Diagramme Fortschrittsdiagramme Zeitpläne Zeitleisten & Roadmaps