Chart Vizzard
Vizzlos KI-basierter Diagramm-GeneratorThe Brexit Referendum, 2016
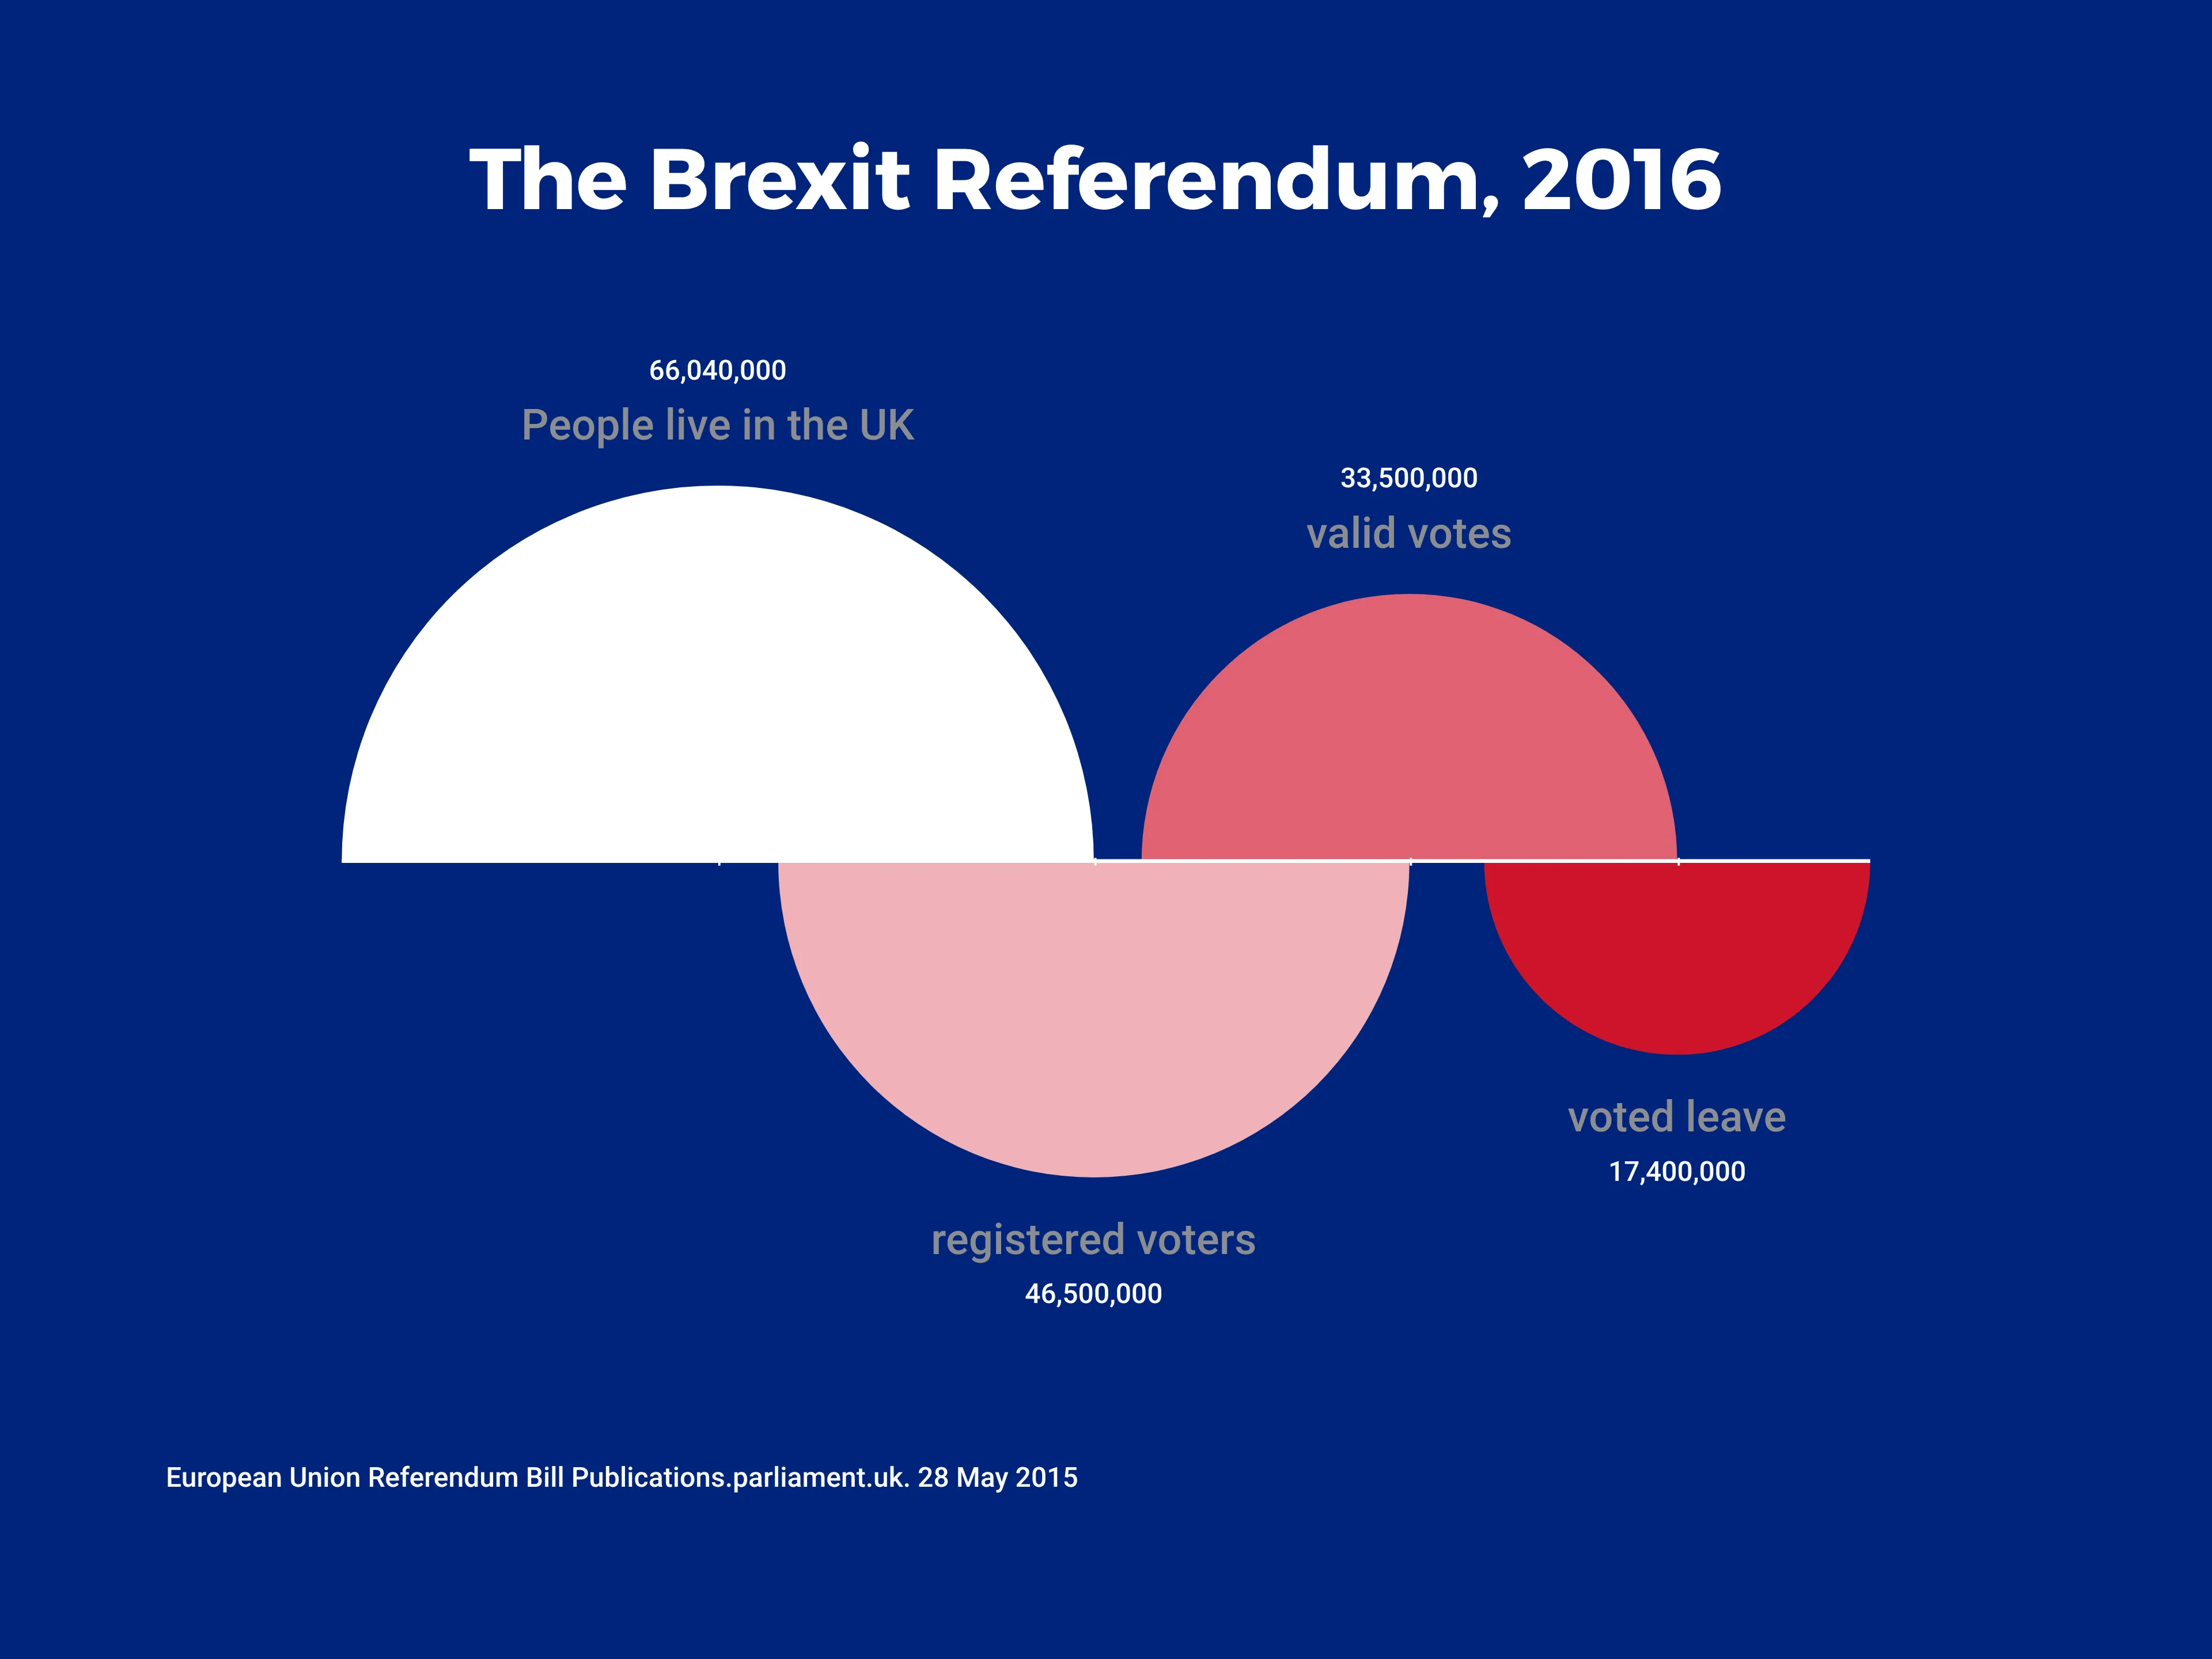
With Brexit coming closer and no deal in sight, this retention chart takes a look at how many people in the U.K actually voted to leave the E.U and how they stack up against the whole population of Britain. Did you know that roughly one third of the British population is not elligible to vote? When you take this into account, in addition to those who chose not to vote and those who voted to ‘remain’, this means that around 17 Million people decided the fate of over 66 Million people.
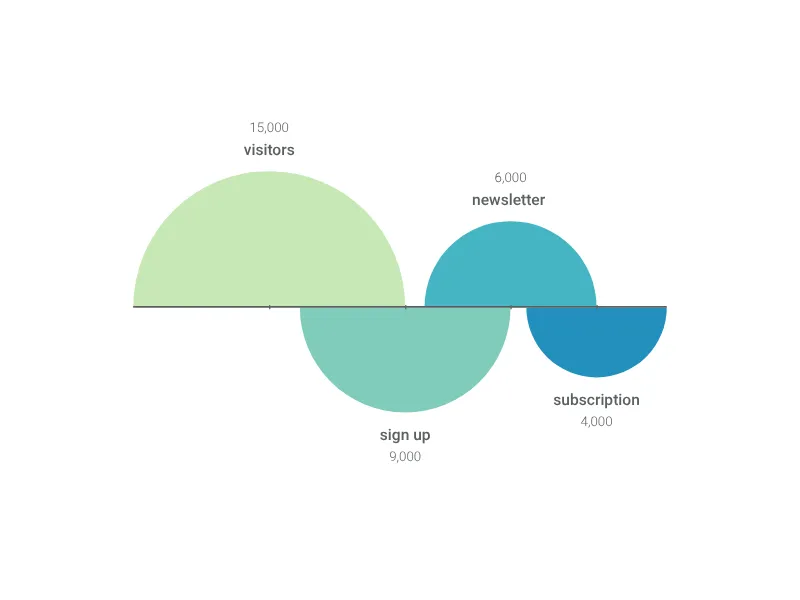
Dies ist ein Beispiel für Vizzlos "Retentiondiagramm"
Visualisieren Sie Ihre Nutzerbindung oder andere einfache Datenreihen mithilfe aufeinanderfolgender Halbkreise.
Finanzen & Wirtschaft Vertrieb & Marketing Linien- & Flächendiagramme Prozess- & Strukturdiagramme