VORSCHAU
Chart Vizzard
Vizzlos KI-basierter Diagramm-GeneratorWhere the World goes on Holidays
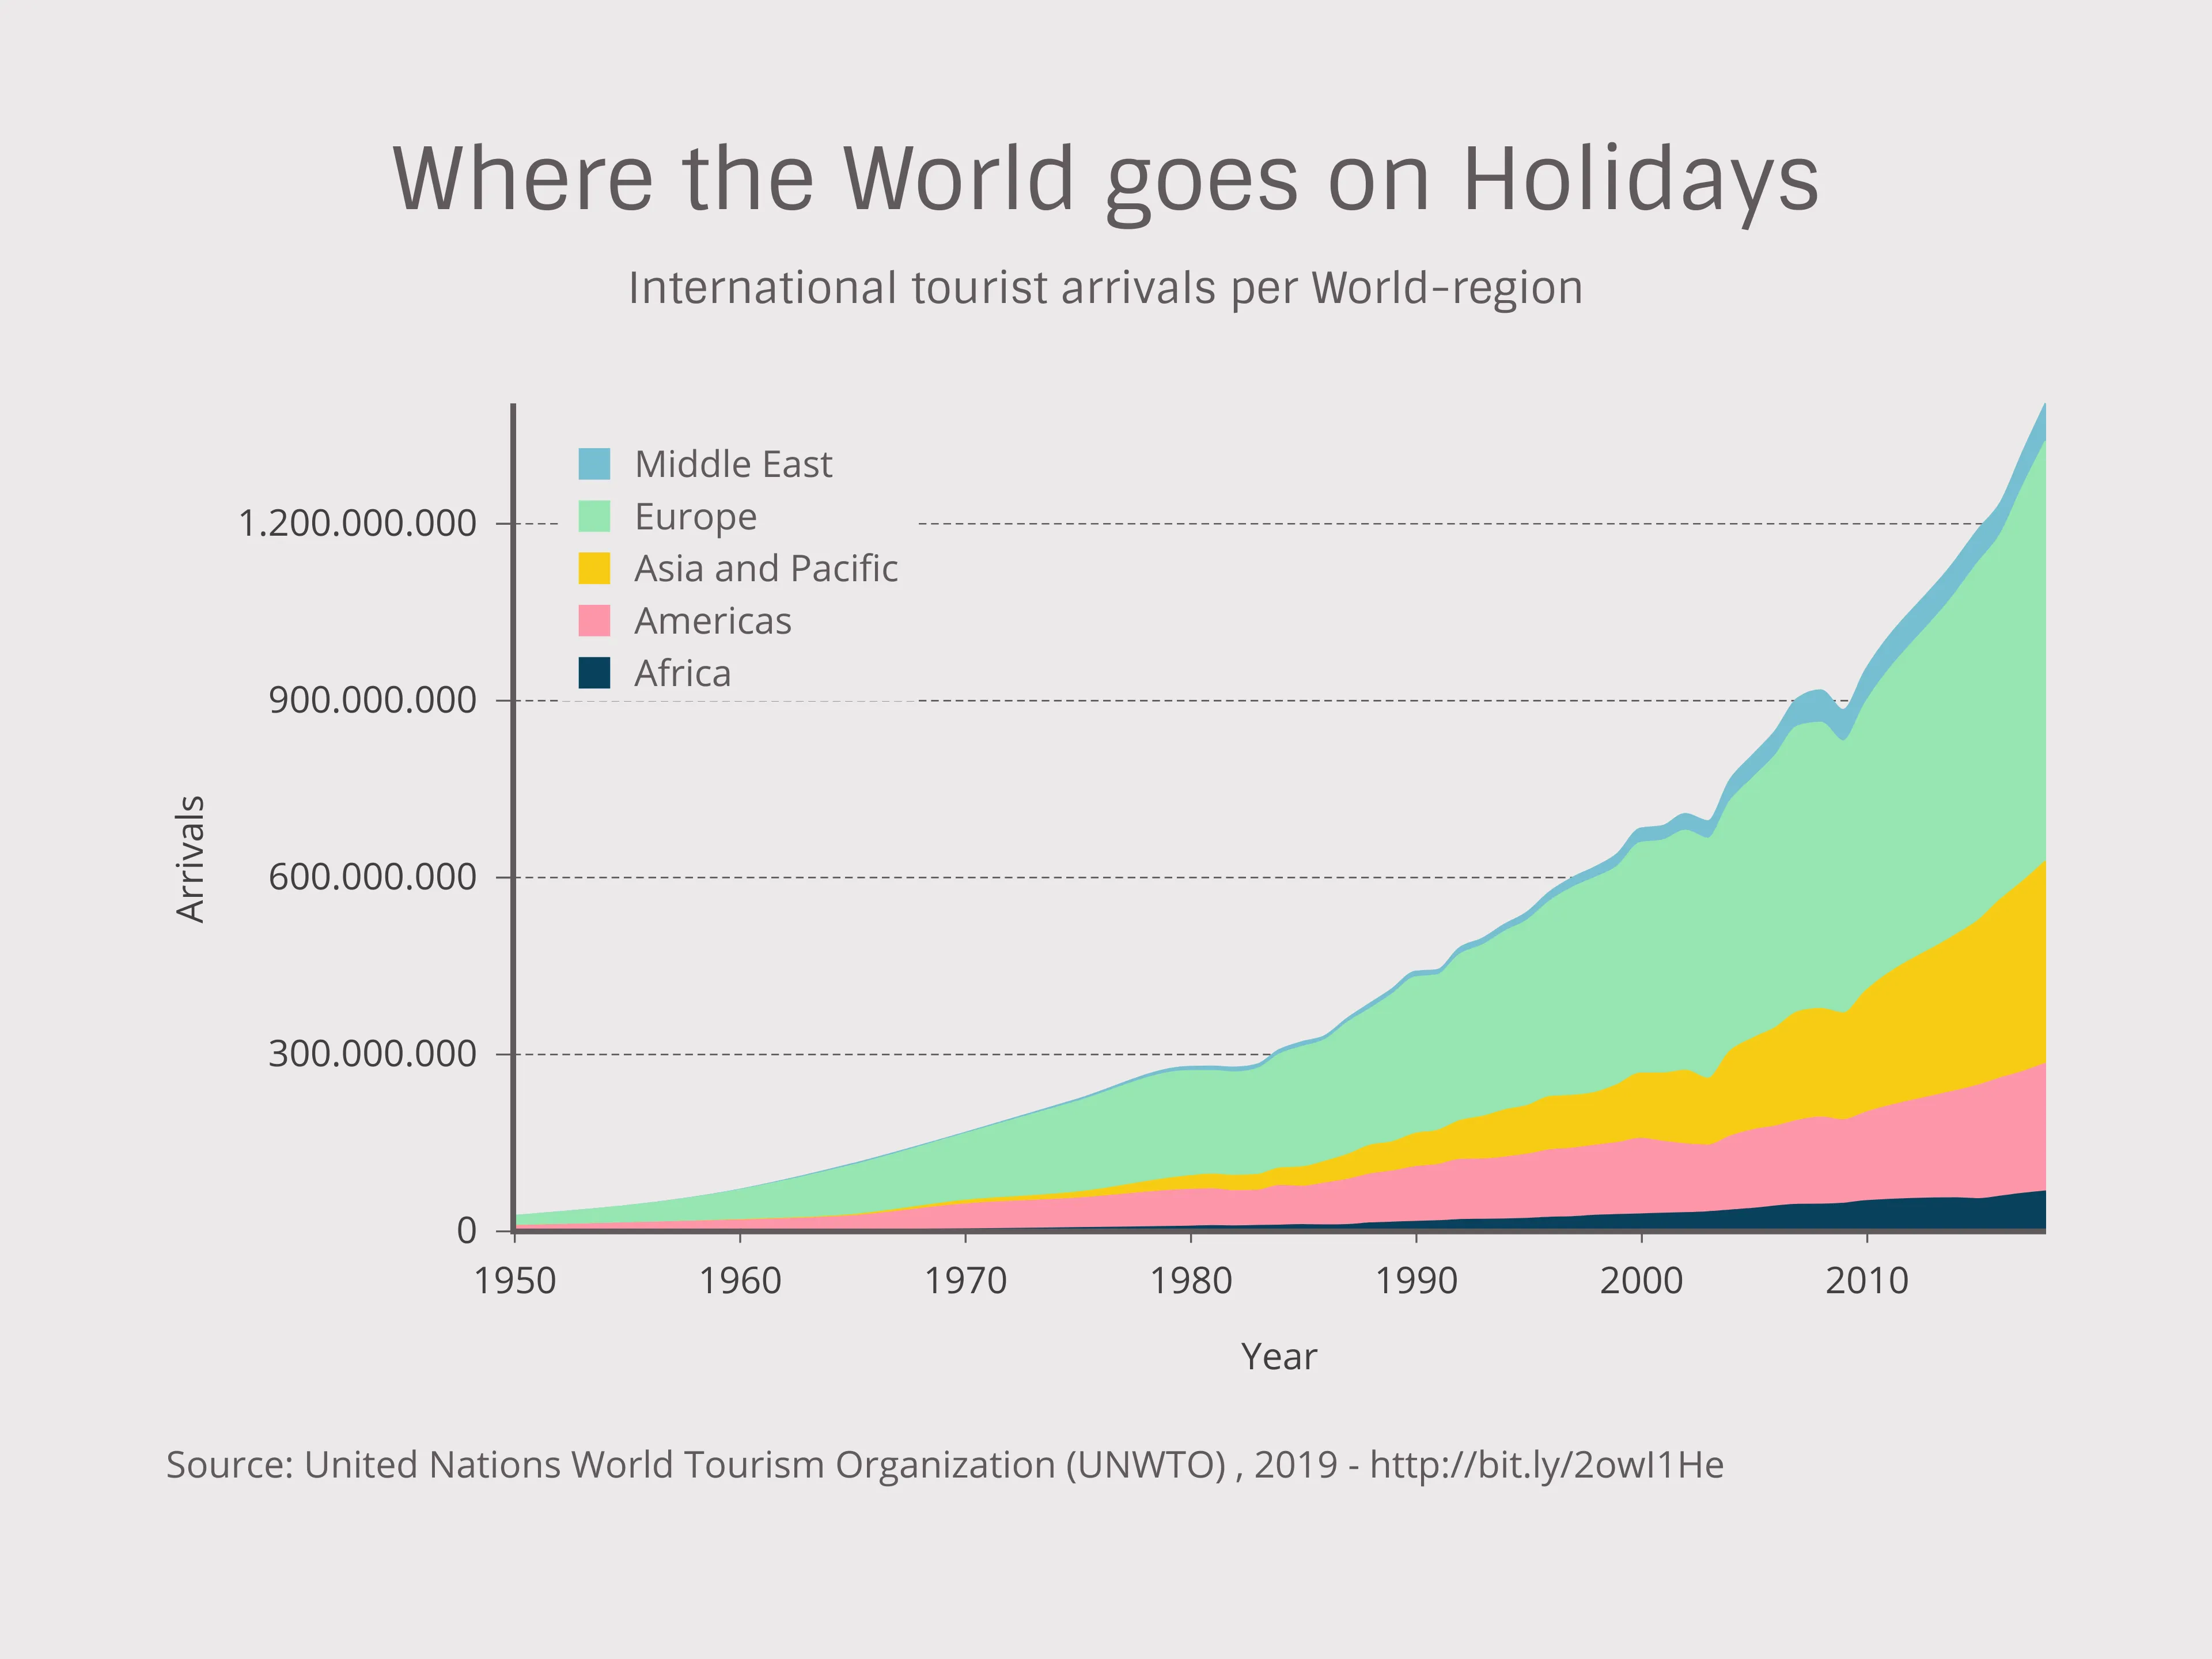
Over 1.4 billion tourists arrive at their destinations all around the globe every year! This graph shows the distribution among the continents and takes a look back at the growth of tourism in the last seventy years.
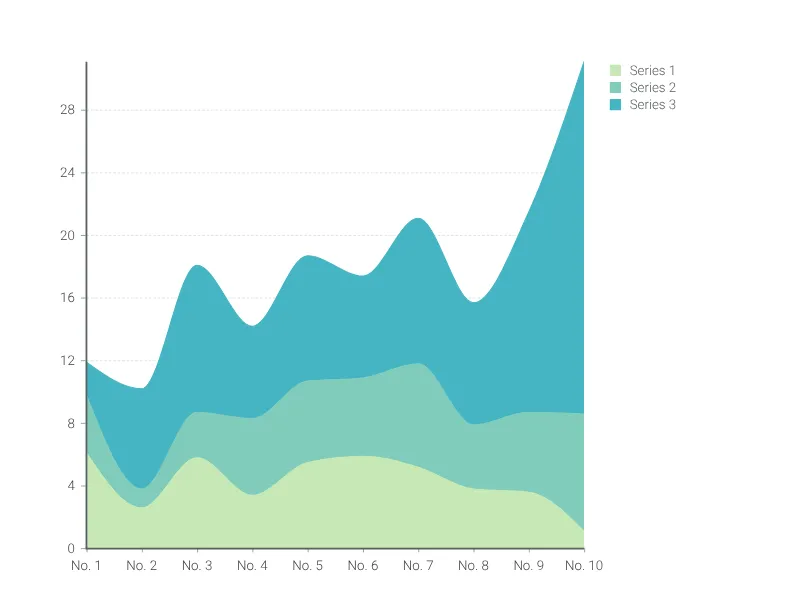
Dies ist ein Beispiel für Vizzlos "Gestapeltes Flächendiagramm"
Visualisieren Sie Veränderungen kumulativer Datenreihen mit dem gestapelten Flächendiagramm.