PREVIEW
Chart Vizzard
Vizzlo's AI-based chart generatorWhere the World goes on Holidays

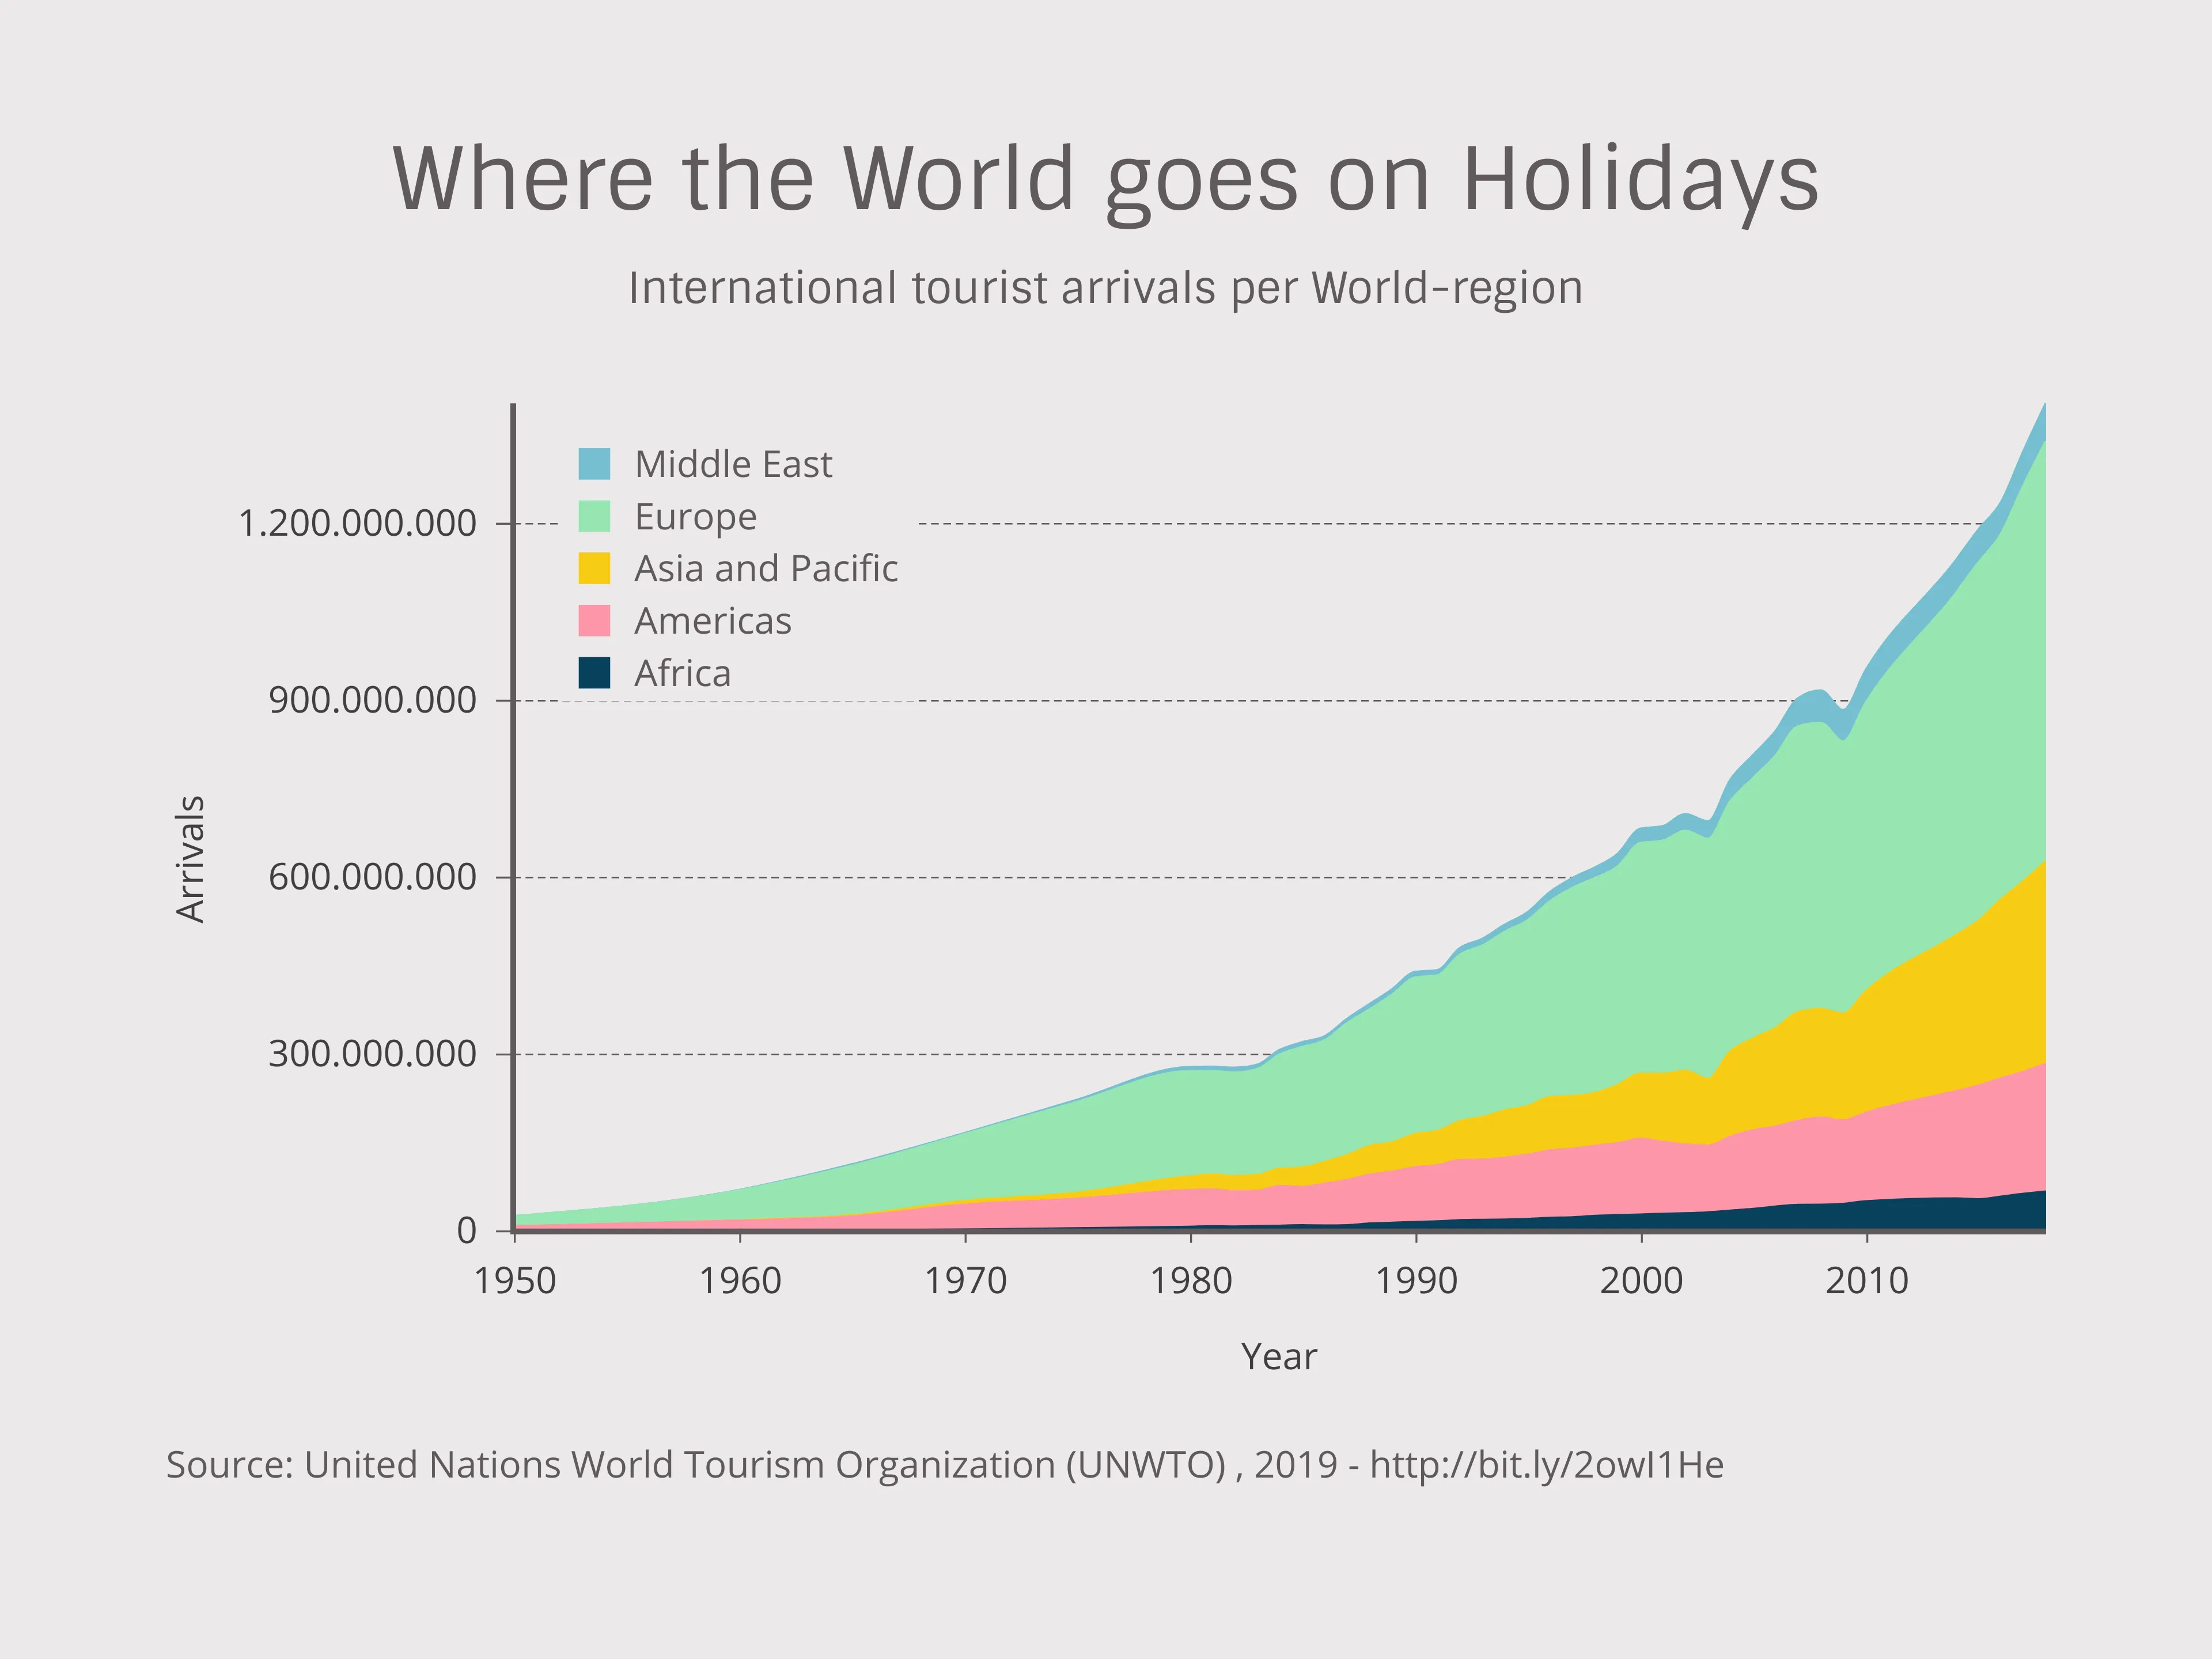
Over 1.4 billion tourists arrive at their destinations all around the globe every year! This graph shows the distribution among the continents and takes a look back at the growth of tourism in the last seventy years.

This is an example of Vizzlo's “Stacked Area Chart”
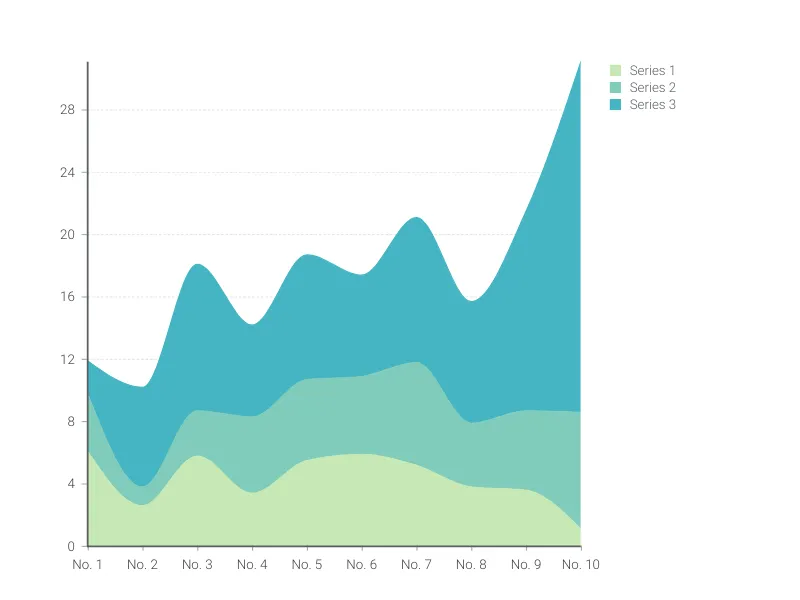
Easily visualize changes of cumulative data series using the stacked area chart.