VORSCHAU
Chart Vizzard
Vizzlos KI-basierter Diagramm-GeneratorHoliday season trends agree with the saying "family comes first"
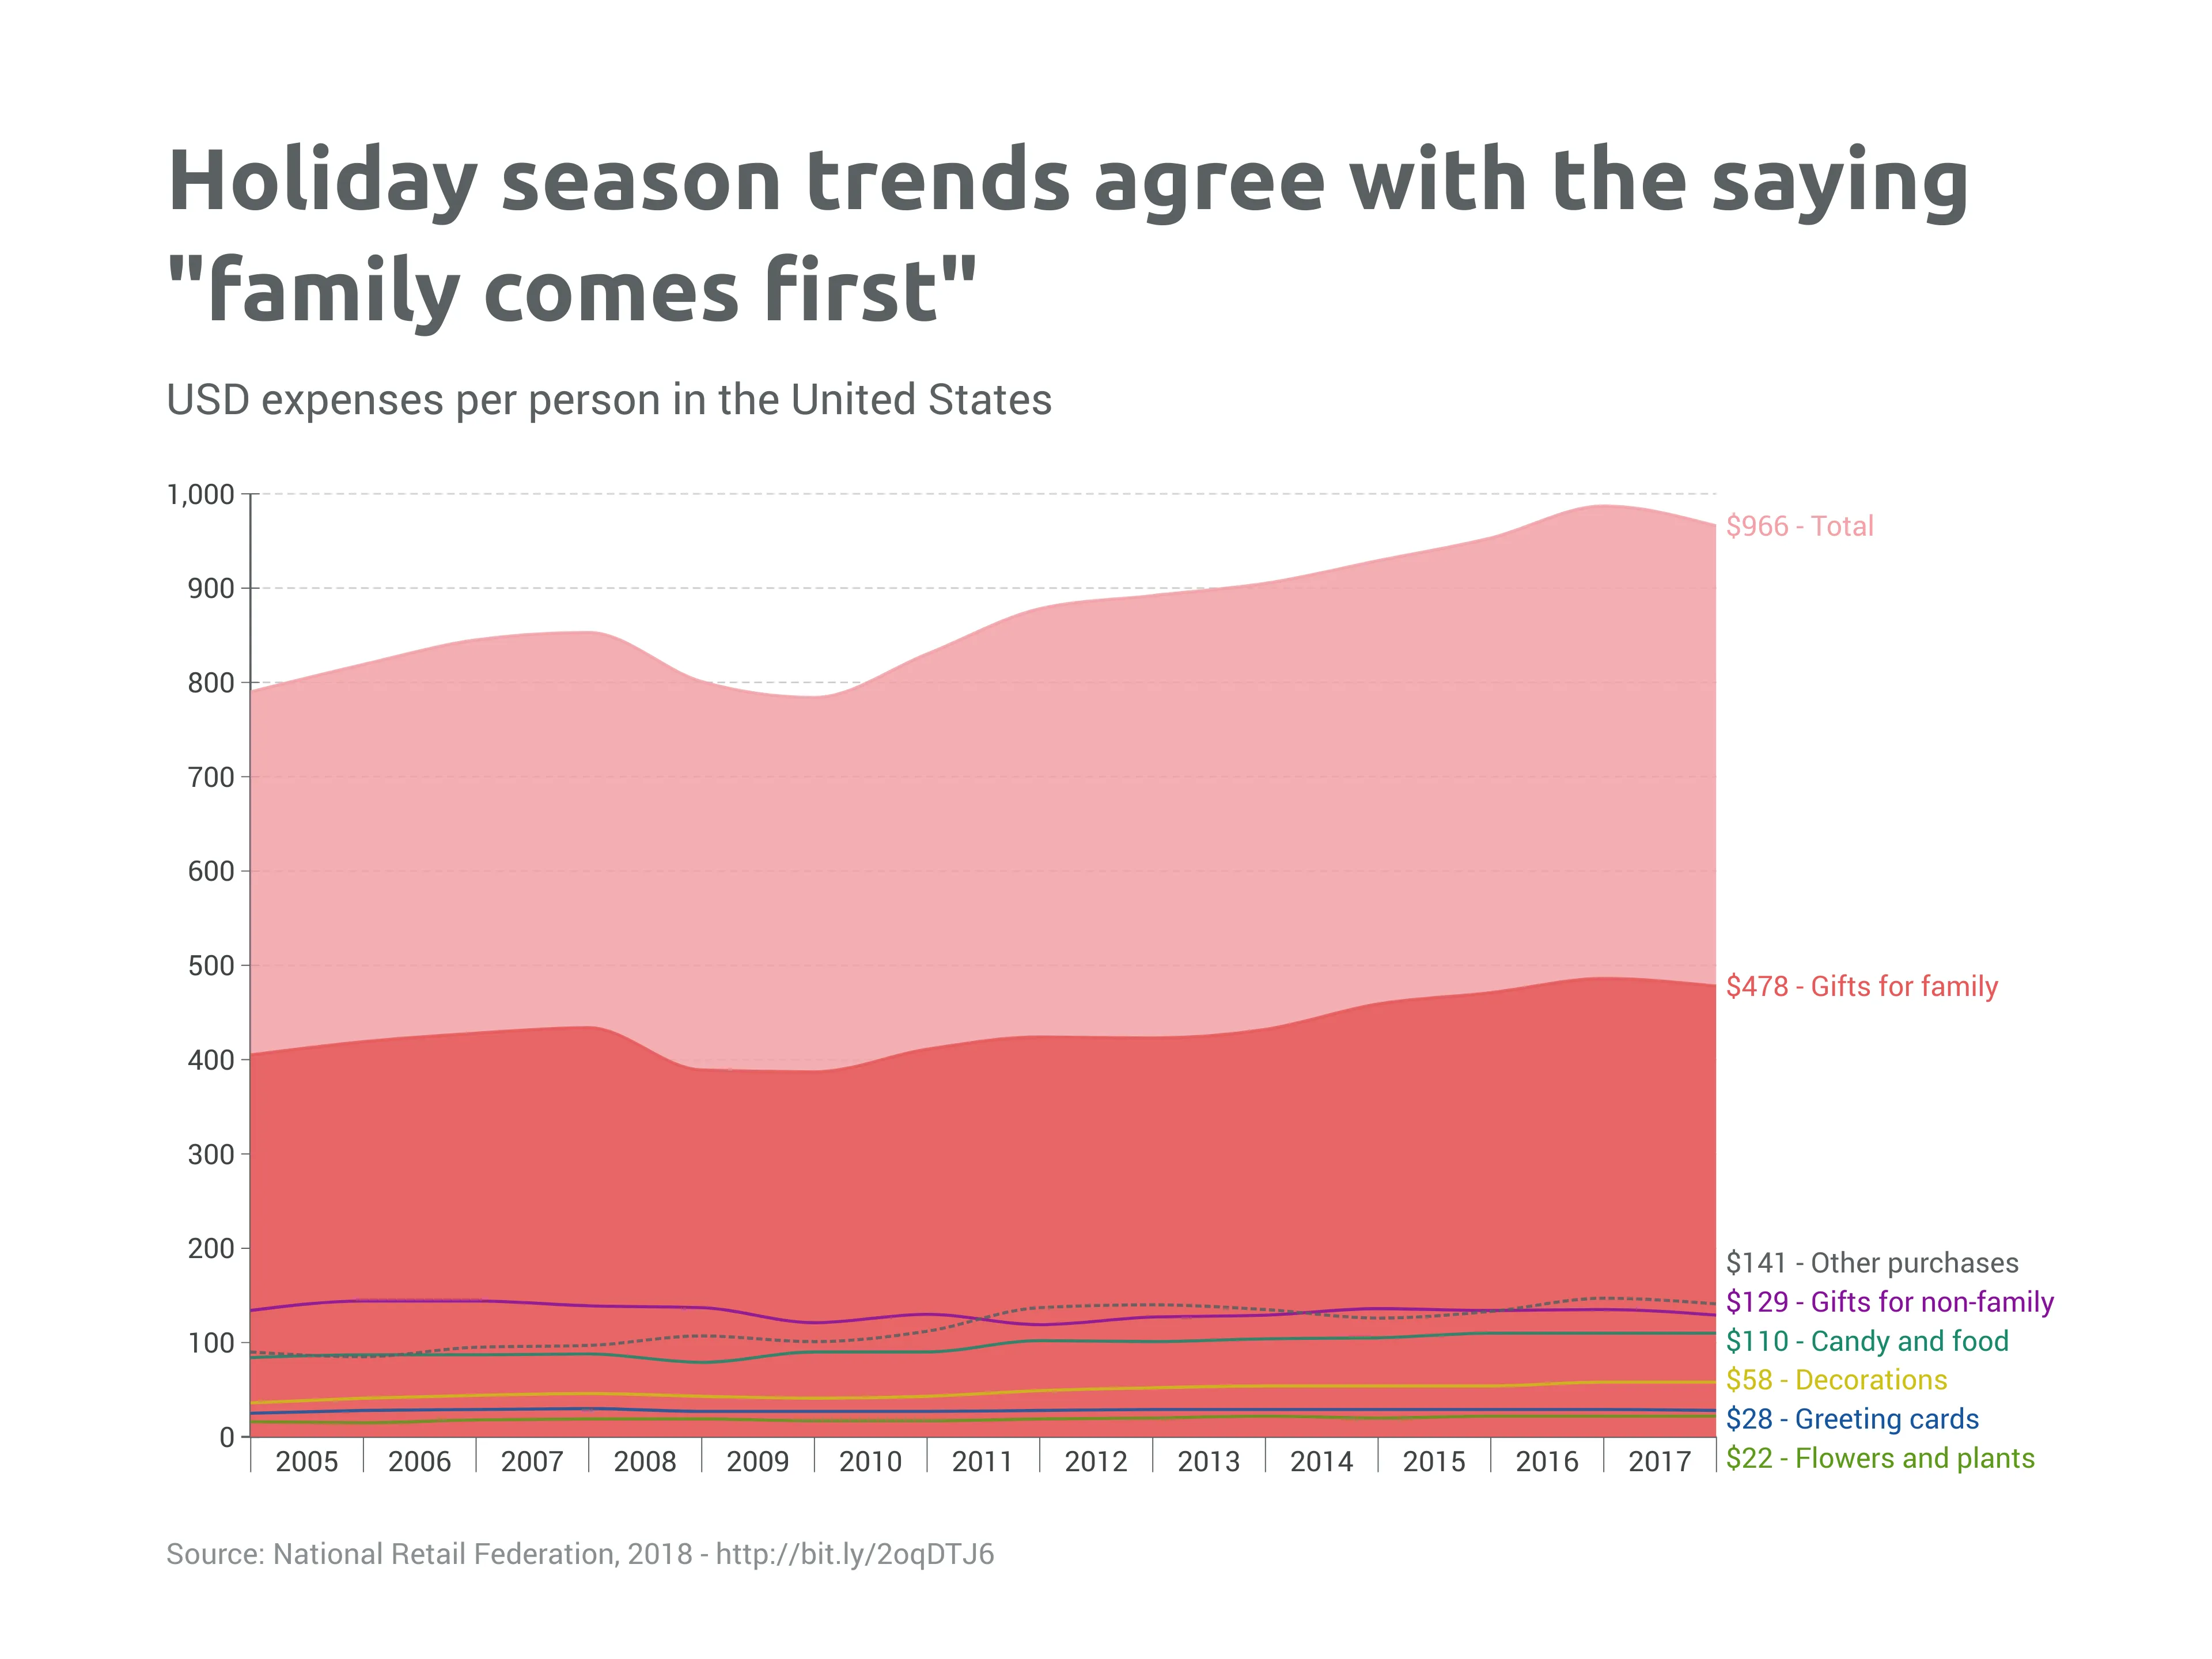
The National Retail Federation defines the holiday season as November and December, and this year’s holiday spending forecast estimates that retail sales will increase between 4.3 percent and 4.8 percent above 2017 numbers. This would put the total in an astounding $720.89 billion in the US alone. How have you kick-started your holiday shopping these Thanksgiving and Black Friday?
Dies ist ein Beispiel für Vizzlos "Zeitreihendiagramm"
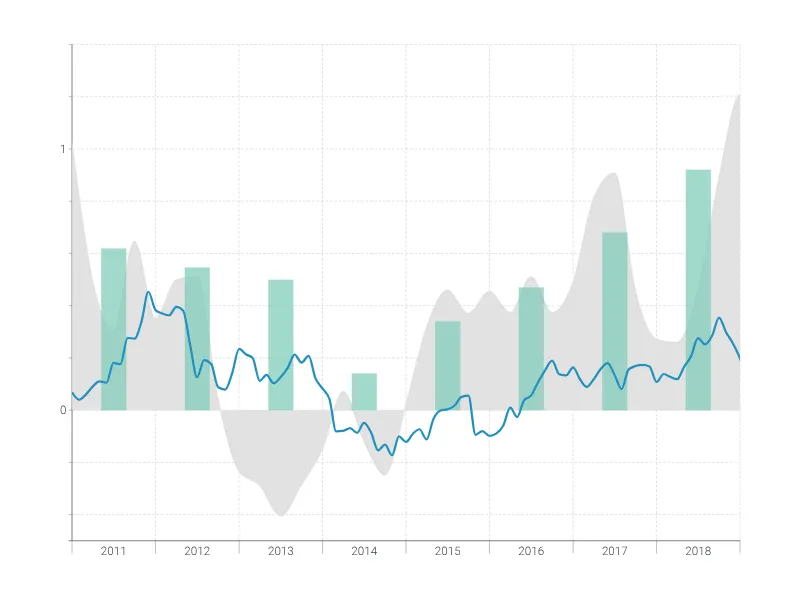
Komplexes Zeitreihendiagramm zur Visualisierung detaillierter Finanzdaten.
Finanzen & Wirtschaft Balken- & Säulendiagramme Linien- & Flächendiagramme Zeitbasierte Diagramme