Chart Vizzard
Vizzlos KI-basierter Diagramm-GeneratorLeipzig Festival of Lights
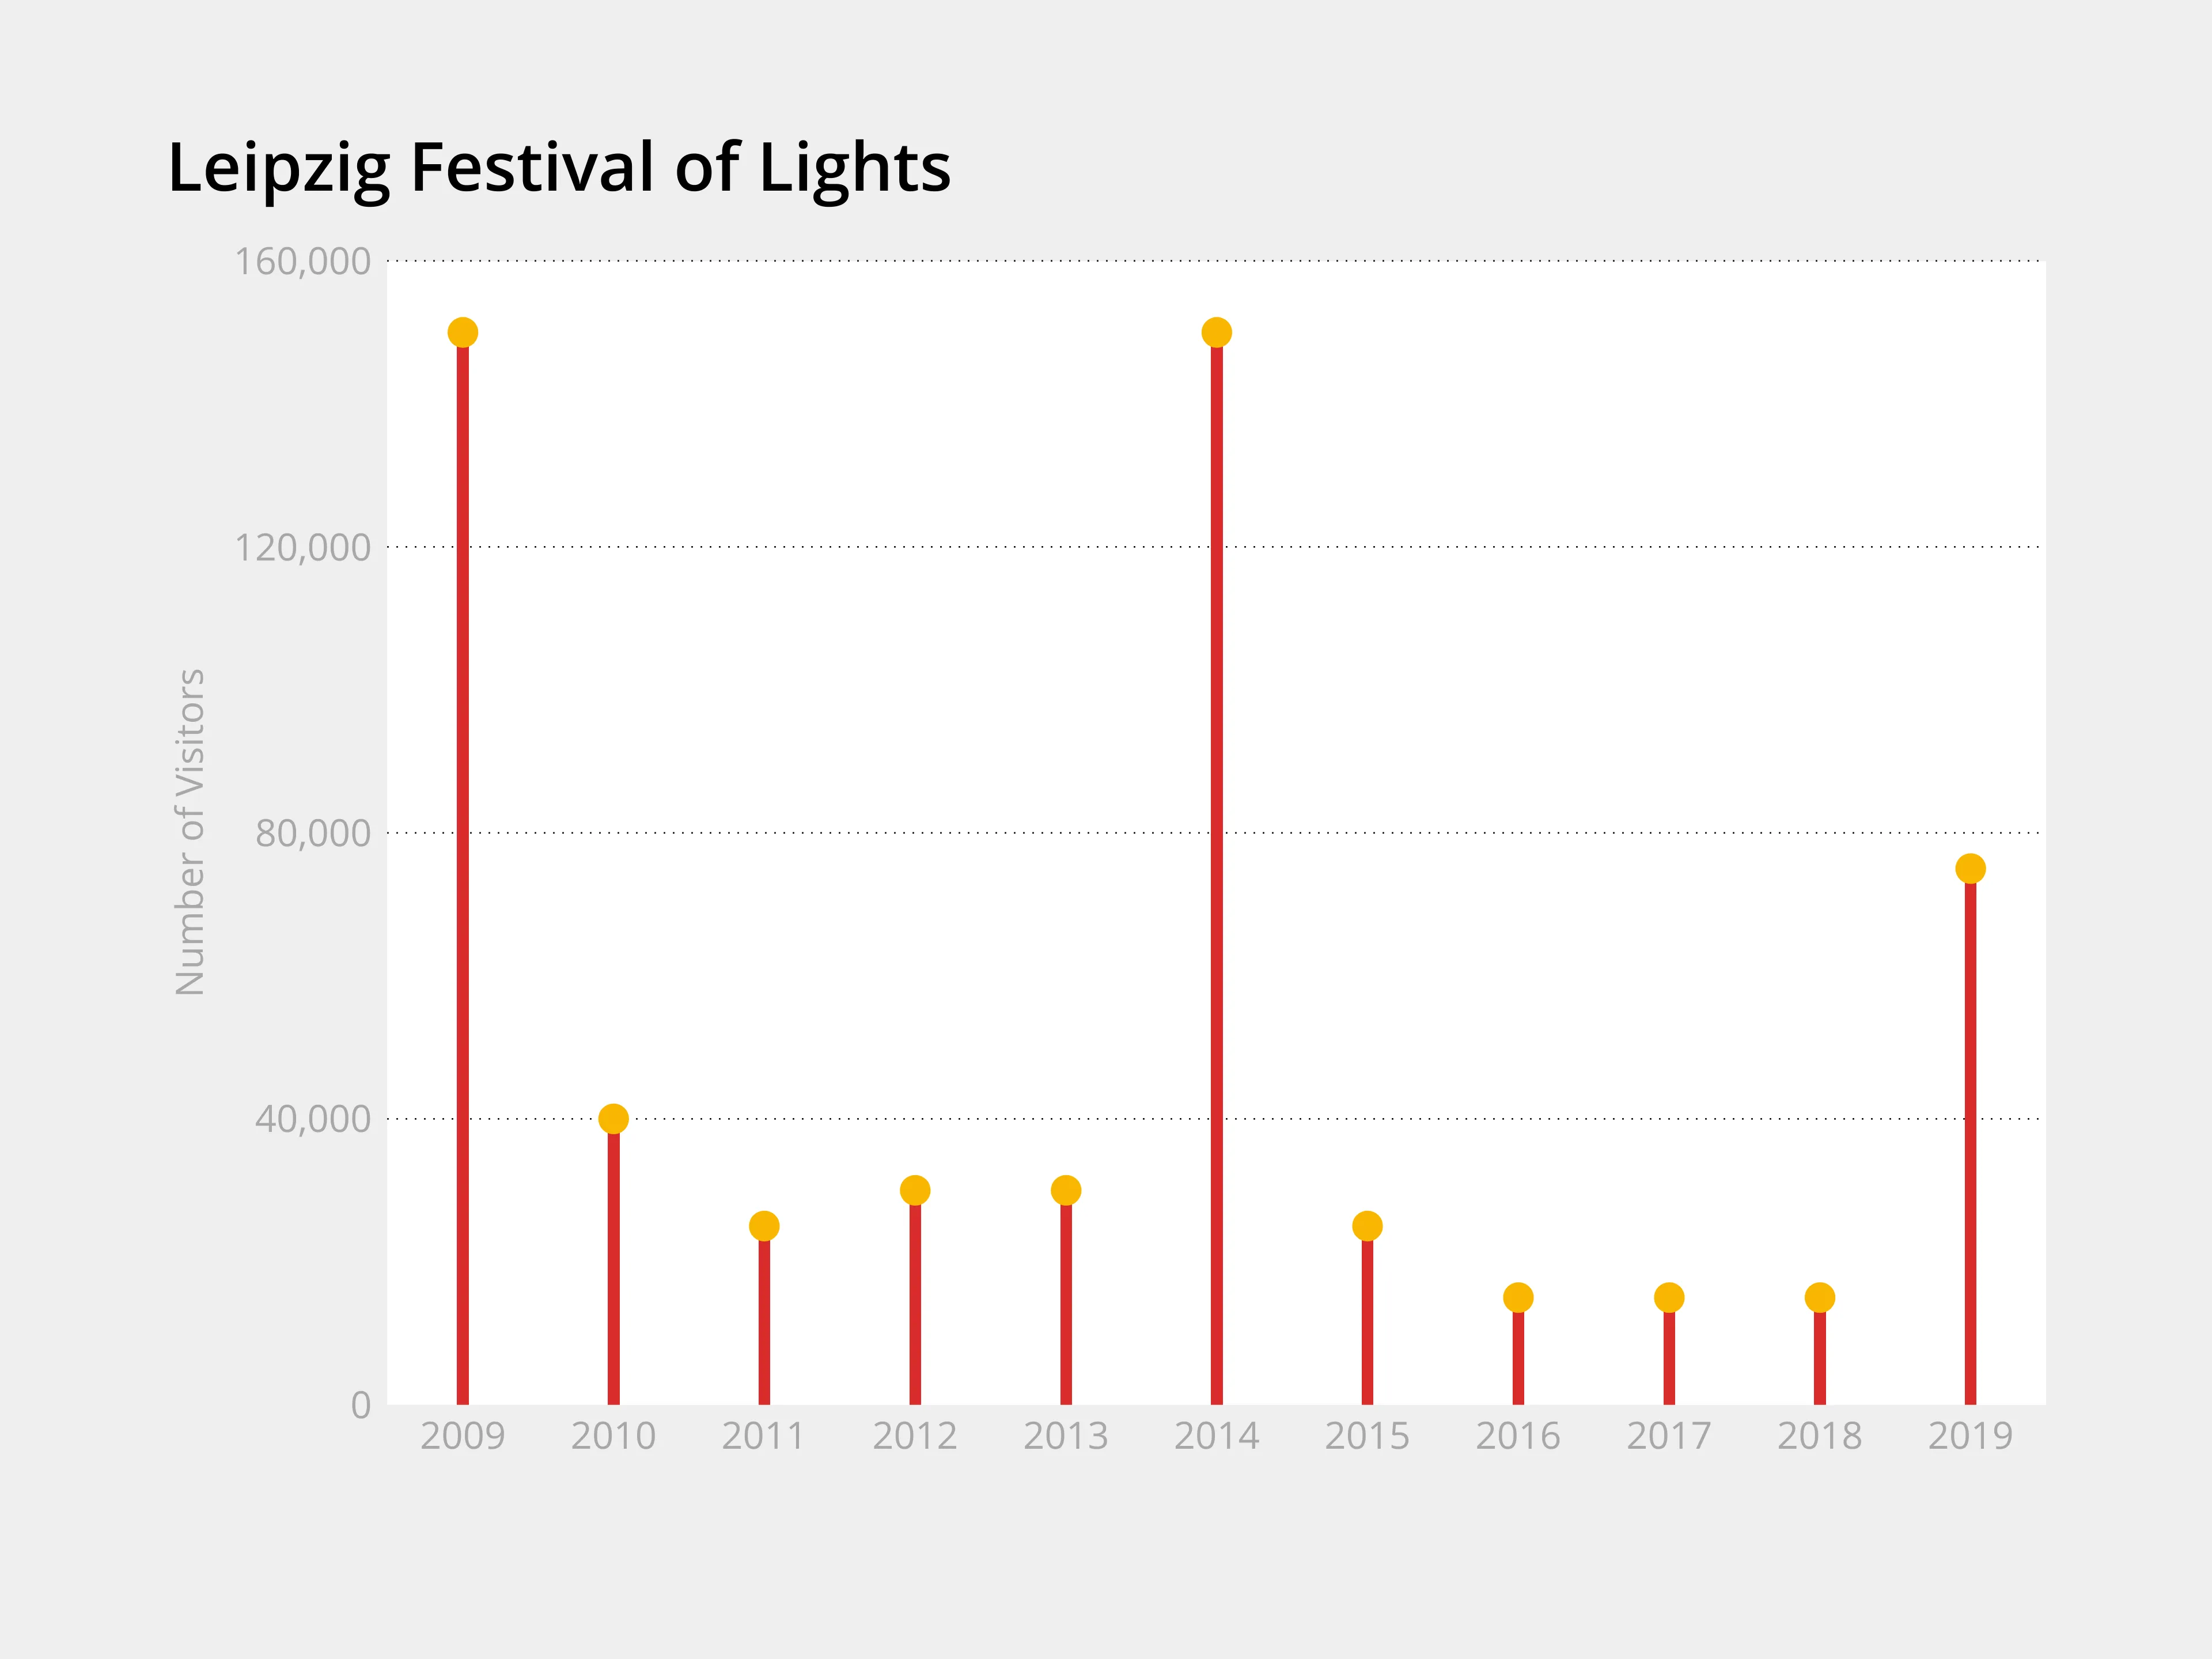
The Leipzig Festival of Lights has been held annually on October 9th since 2009. On that day in 1989, around 70,000 people took to the streets. They were peacefully demanding freedom and democracy.
The demonstration marks the first climax of the Peaceful Revolution in the GDR. In Leipzig, the state power capitulated to the people for the first time, and this event announced the end of the SED regime. The remembrance of those days is kept alive by the citizens of Leipzig.
Given the current situation, the Leipzig Festival of Lights cannot take place in the usual way this year. Visitors will meet in a live stream to be together ‘on-site’.
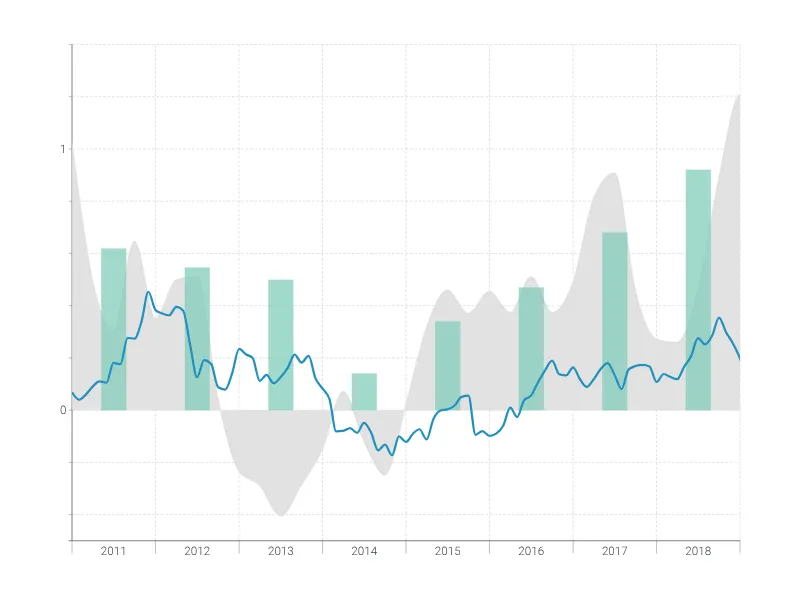
Dies ist ein Beispiel für Vizzlos "Zeitreihendiagramm"
Komplexes Zeitreihendiagramm zur Visualisierung detaillierter Finanzdaten.
Finanzen & Wirtschaft Balken- & Säulendiagramme Linien- & Flächendiagramme Zeitbasierte Diagramme