Chart Vizzard
Vizzlos KI-basierter Diagramm-GeneratorSeasons might not win Championships
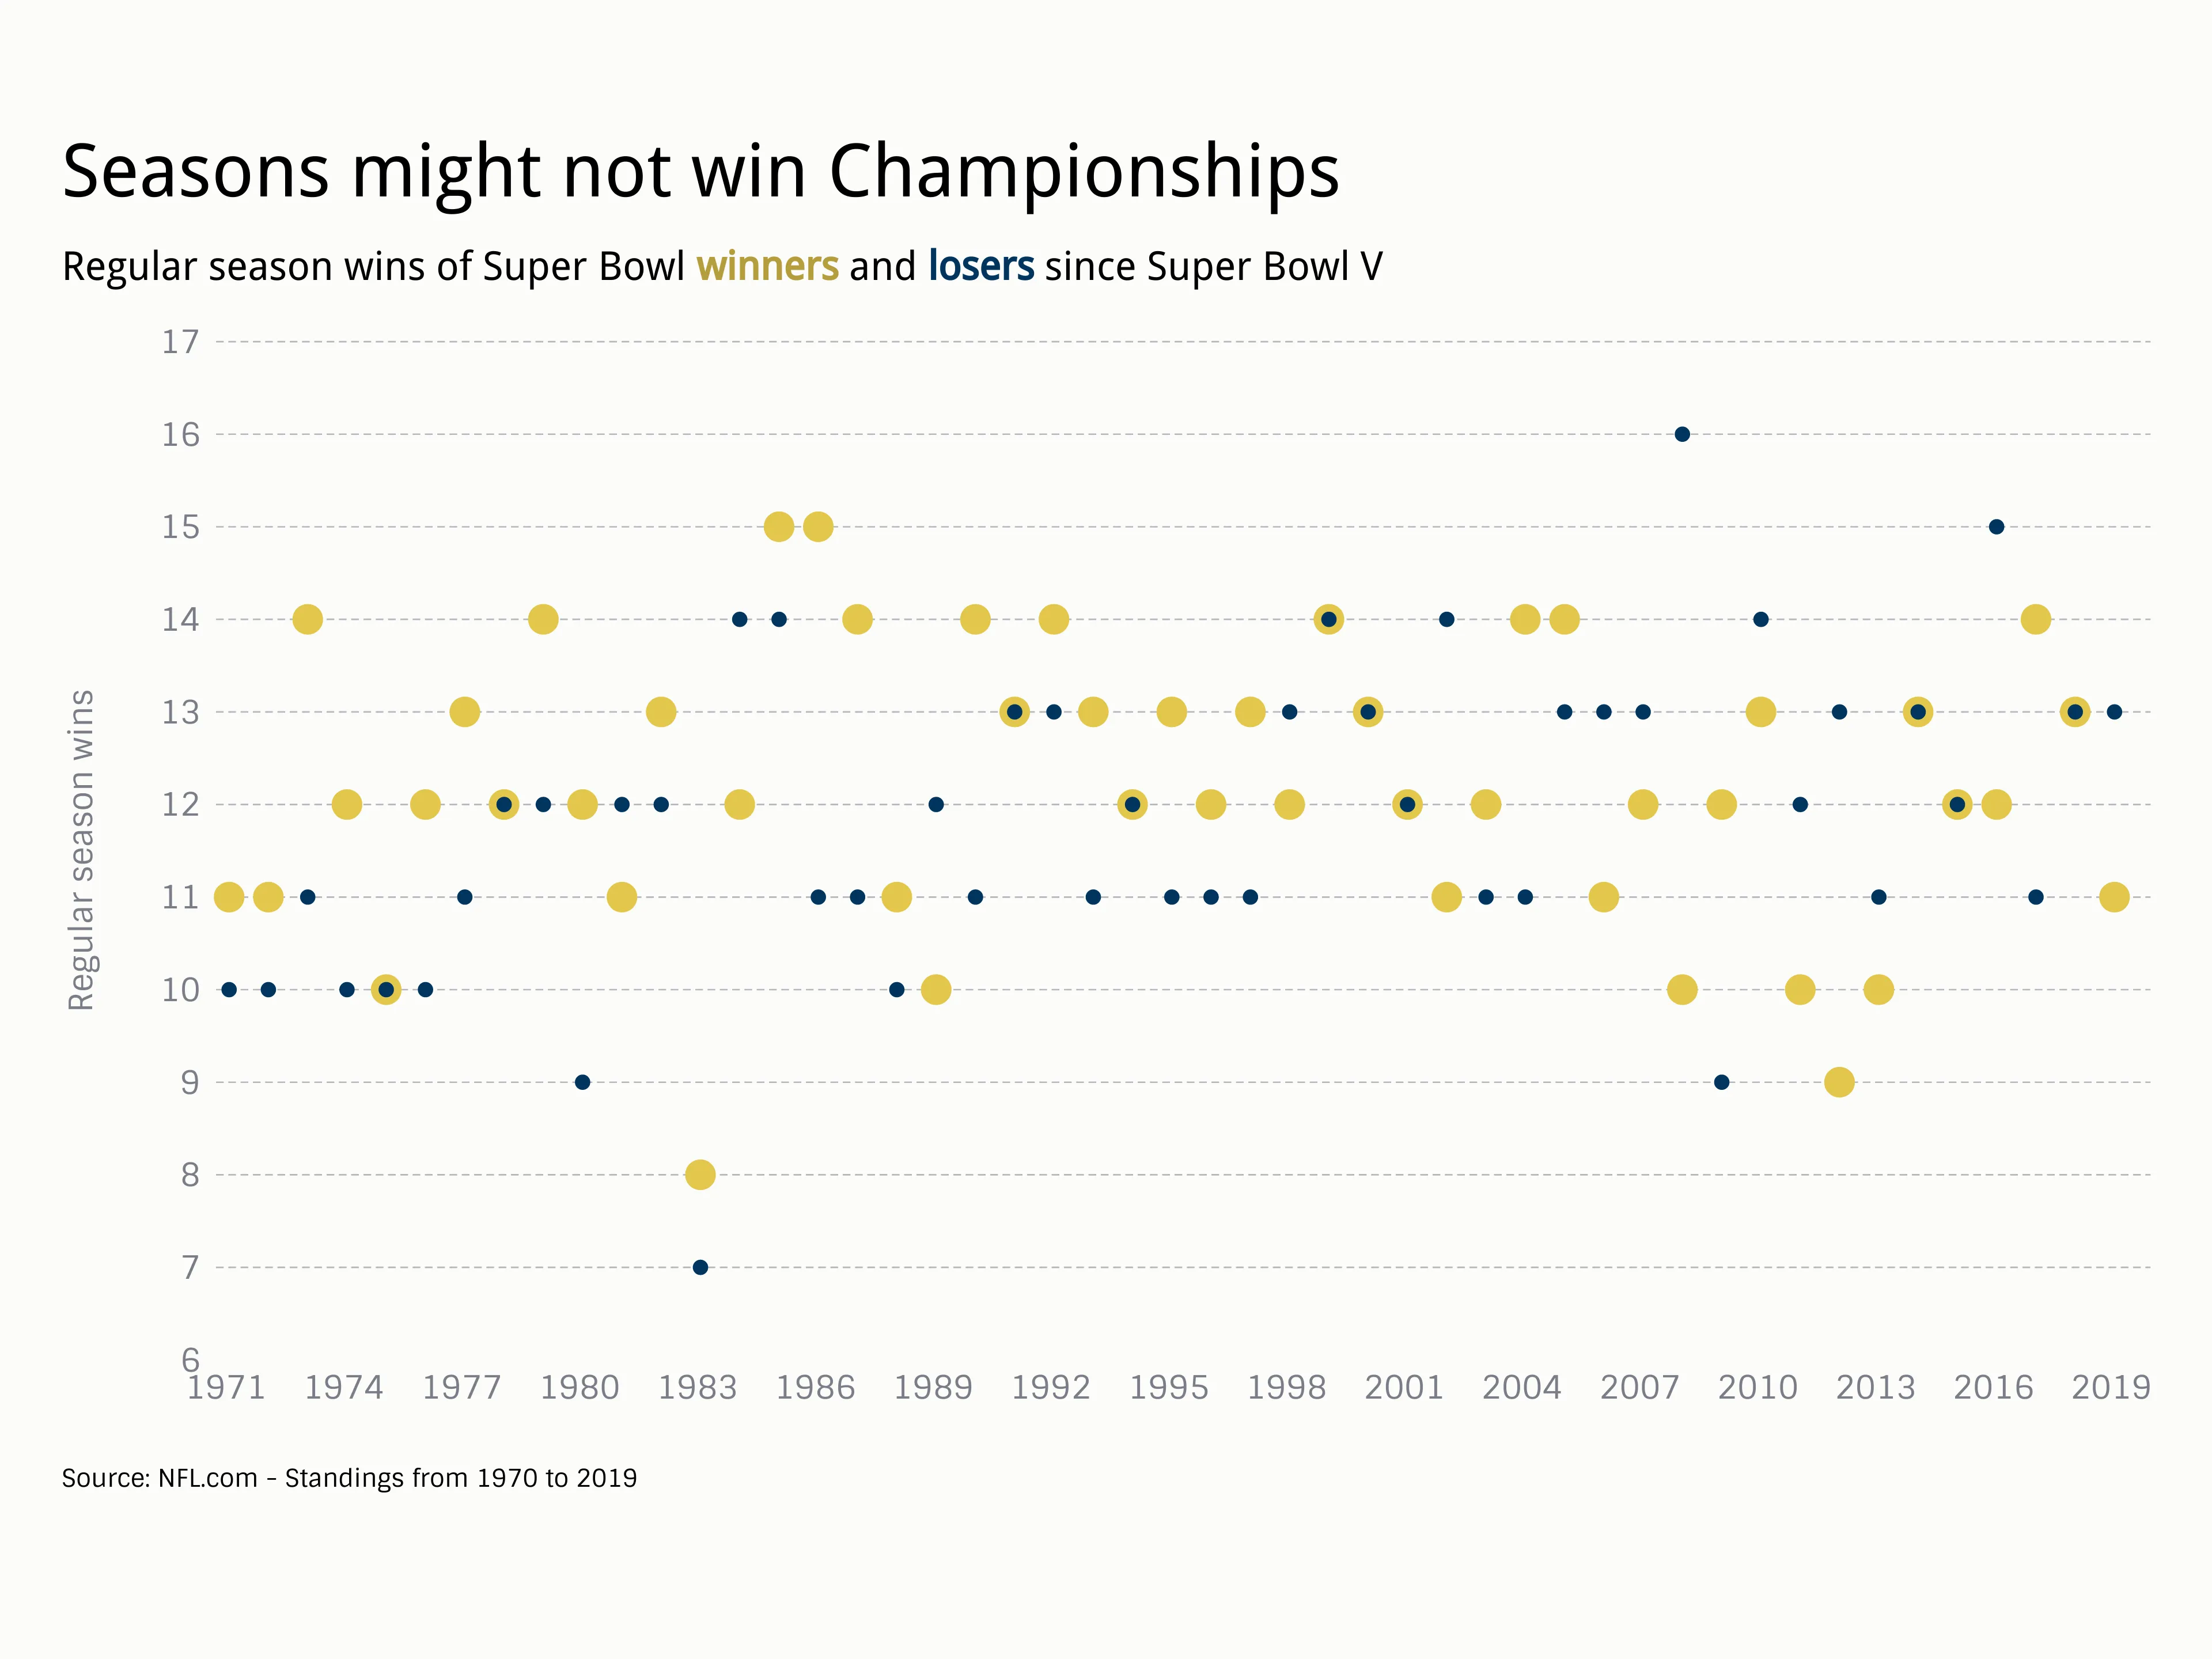
With Super Bowl LIV drawing near we wanted to see wether the better performing team during regular Season would go into the big game as a favorite. So we plotted the amount of regular season wins for each year since Super Bowl V to see if the team with the better record would come out on top. While our assumption was definitely correct for the 80’s, 90’s and 00’s, the last ten years have seen 6 upsets, three even matchups and just one stronger regular season team taking the trophy. Which might be a good omen for the Kansas City Chiefs going into Super Bowl LIV.
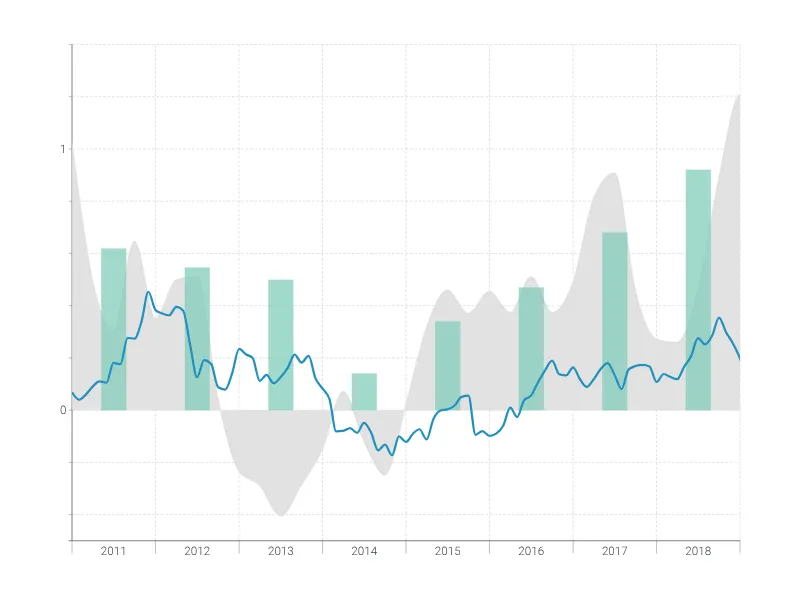
Dies ist ein Beispiel für Vizzlos "Zeitreihendiagramm"
Komplexes Zeitreihendiagramm zur Visualisierung detaillierter Finanzdaten.
Finanzen & Wirtschaft Balken- & Säulendiagramme Linien- & Flächendiagramme Zeitbasierte Diagramme