Chart Vizzard
Vizzlos KI-basierter Diagramm-GeneratorThe Rise of Solitude
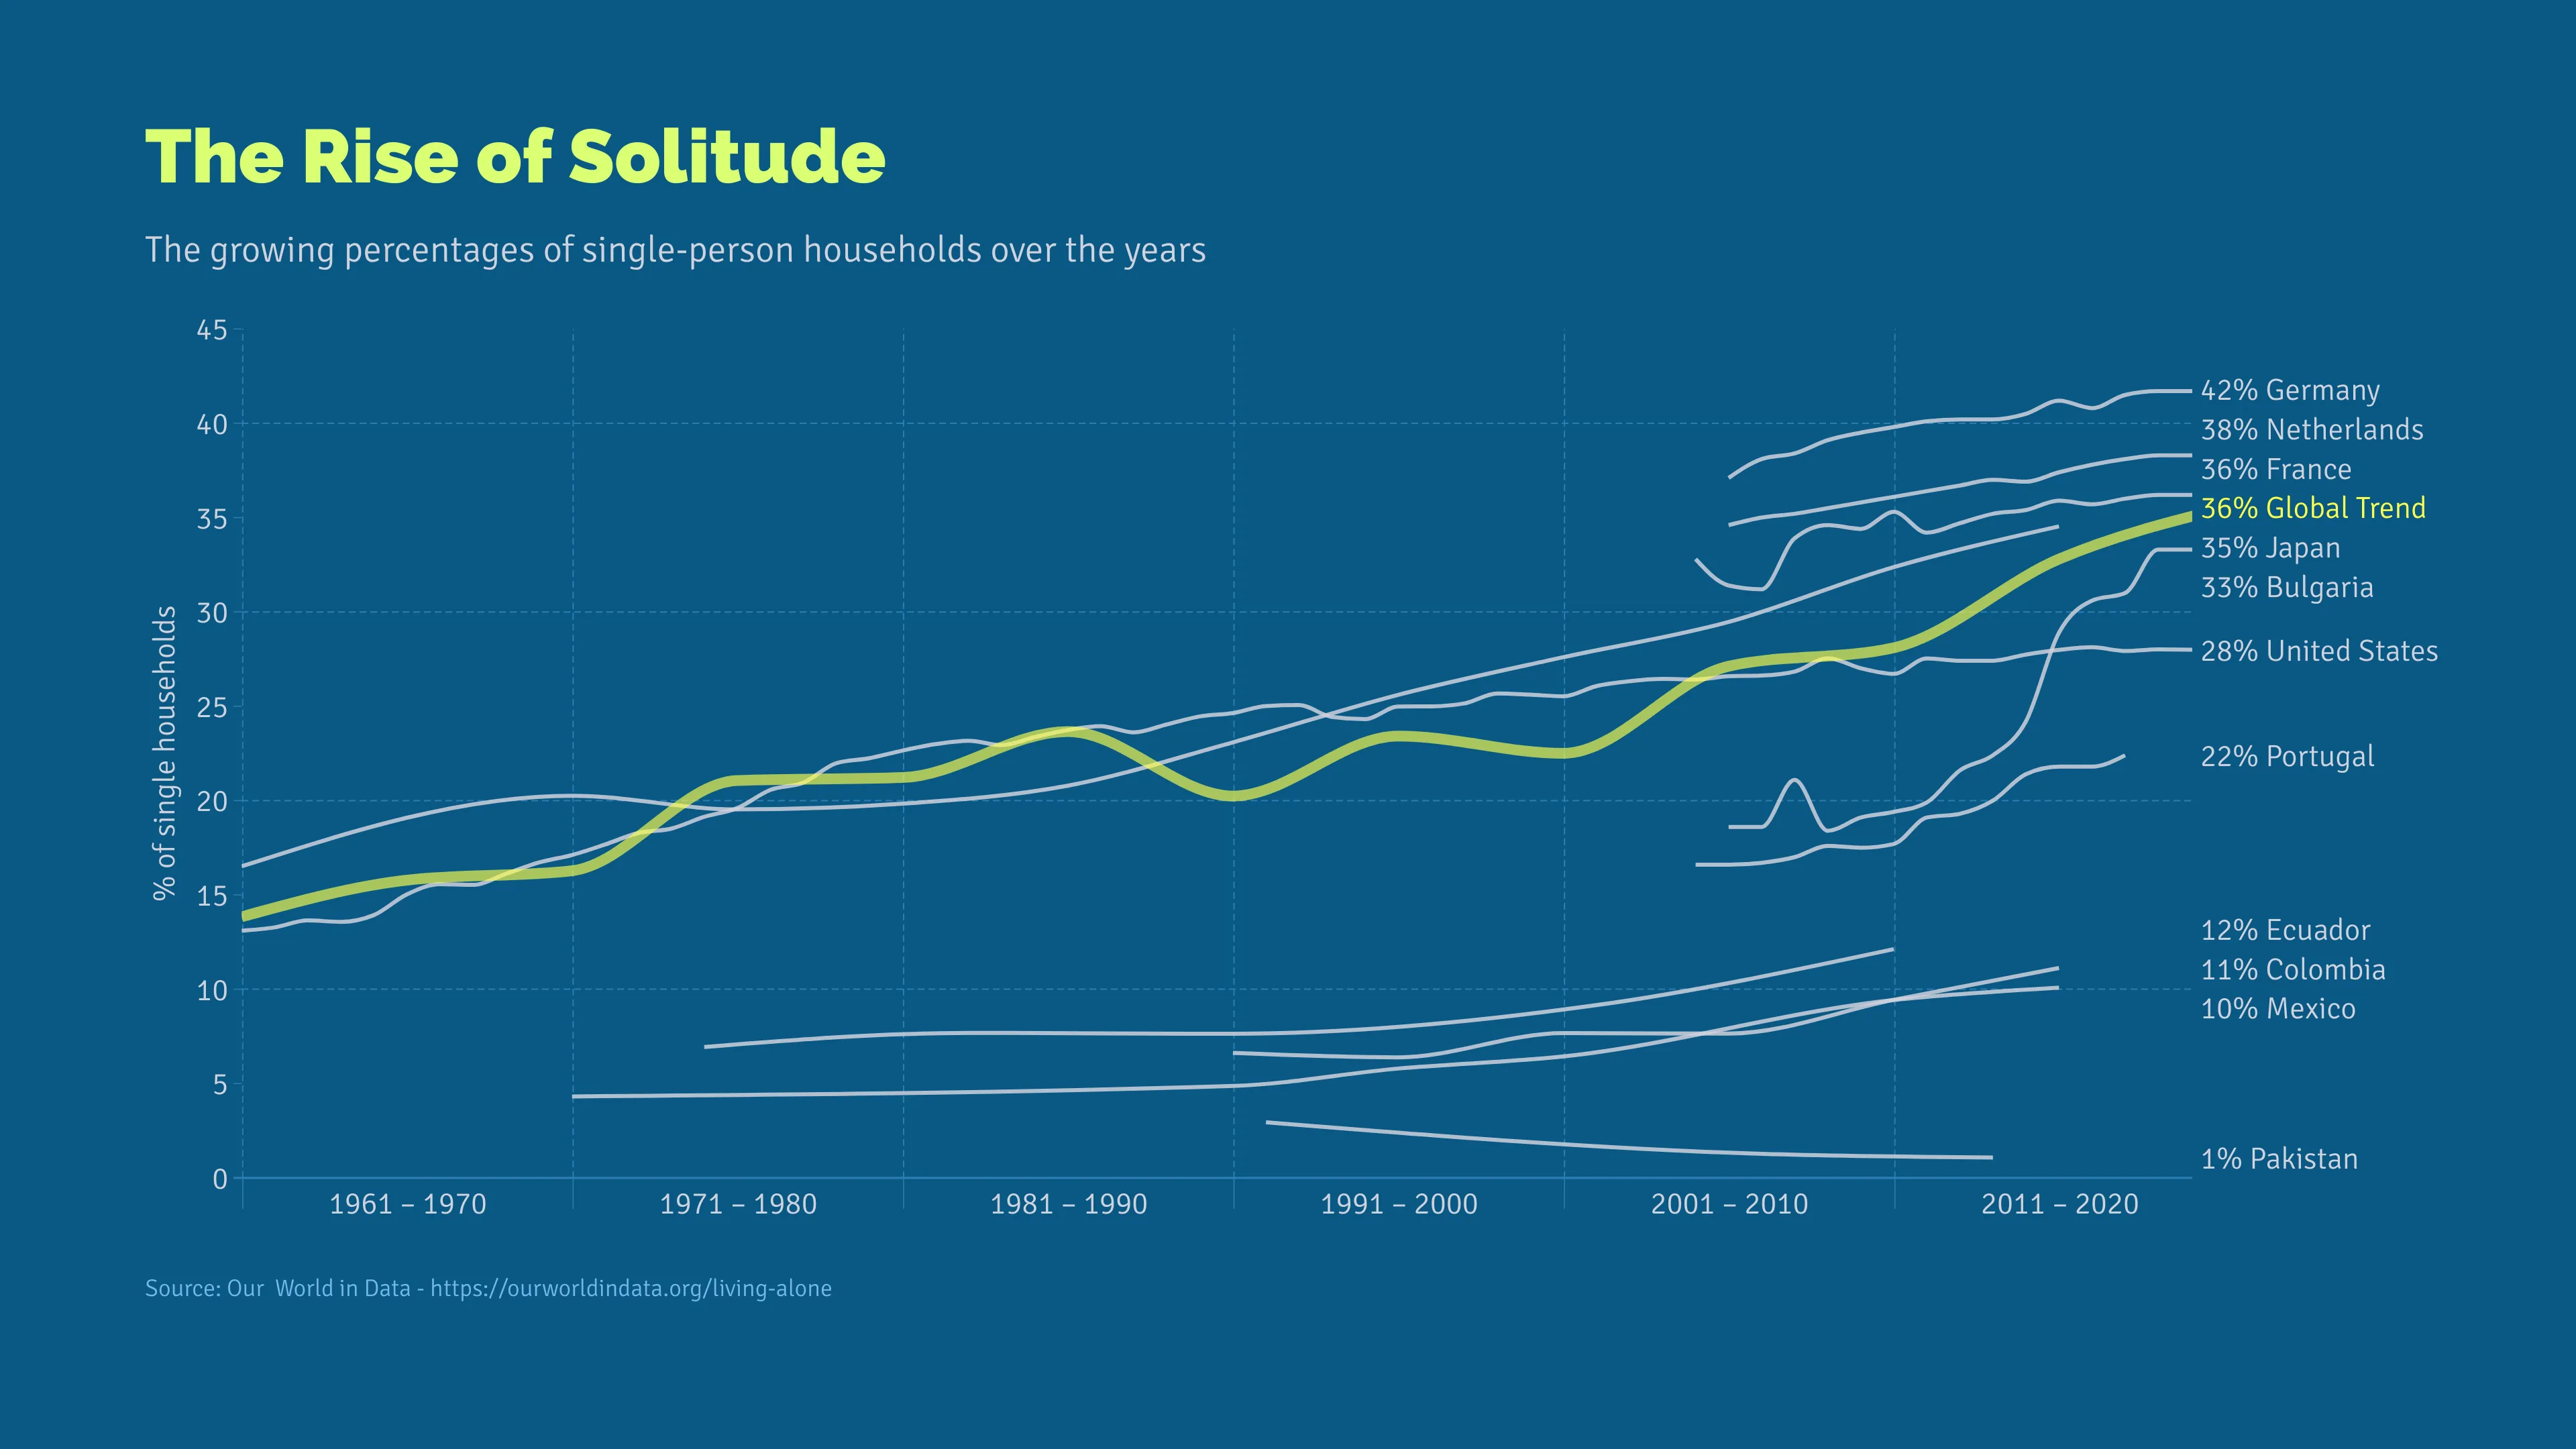
Since our data set begins in 1961, the average global percentage of people living alone has more than doubled. Birth rates are currently in decline, and many adults are choosing not to pursue a traditional family life, both of which results in the steep incline of single-person households. Nowhere is this more pronounced than Bulgaria, where in just 15 years the percentage of the population living alone has grown from 18.6% to 33%. The only outlier in our dataset is Pakistan, in which solo-living rates have actually decreased.
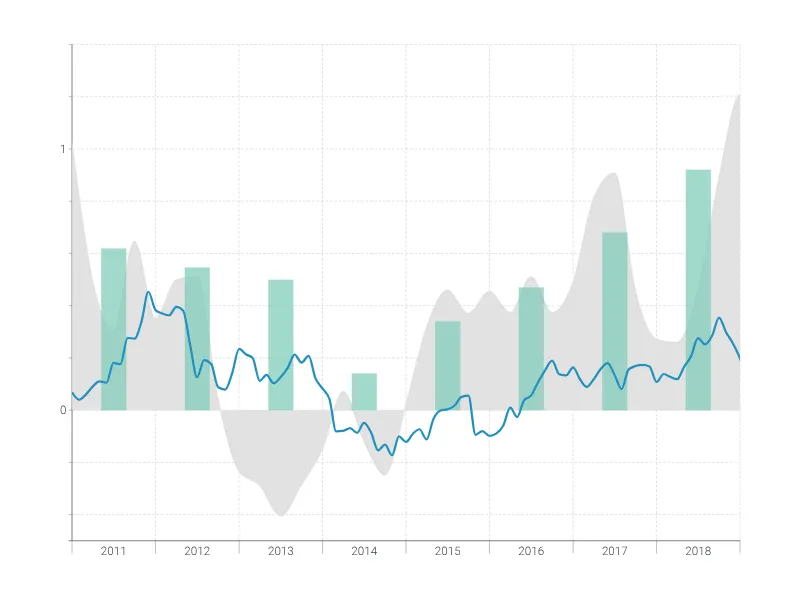
Dies ist ein Beispiel für Vizzlos "Zeitreihendiagramm"
Komplexes Zeitreihendiagramm zur Visualisierung detaillierter Finanzdaten.
Finanzen & Wirtschaft Balken- & Säulendiagramme Linien- & Flächendiagramme Zeitbasierte Diagramme