Chart Vizzard
Vizzlos KI-basierter Diagramm-GeneratorTiny Gains are powerful
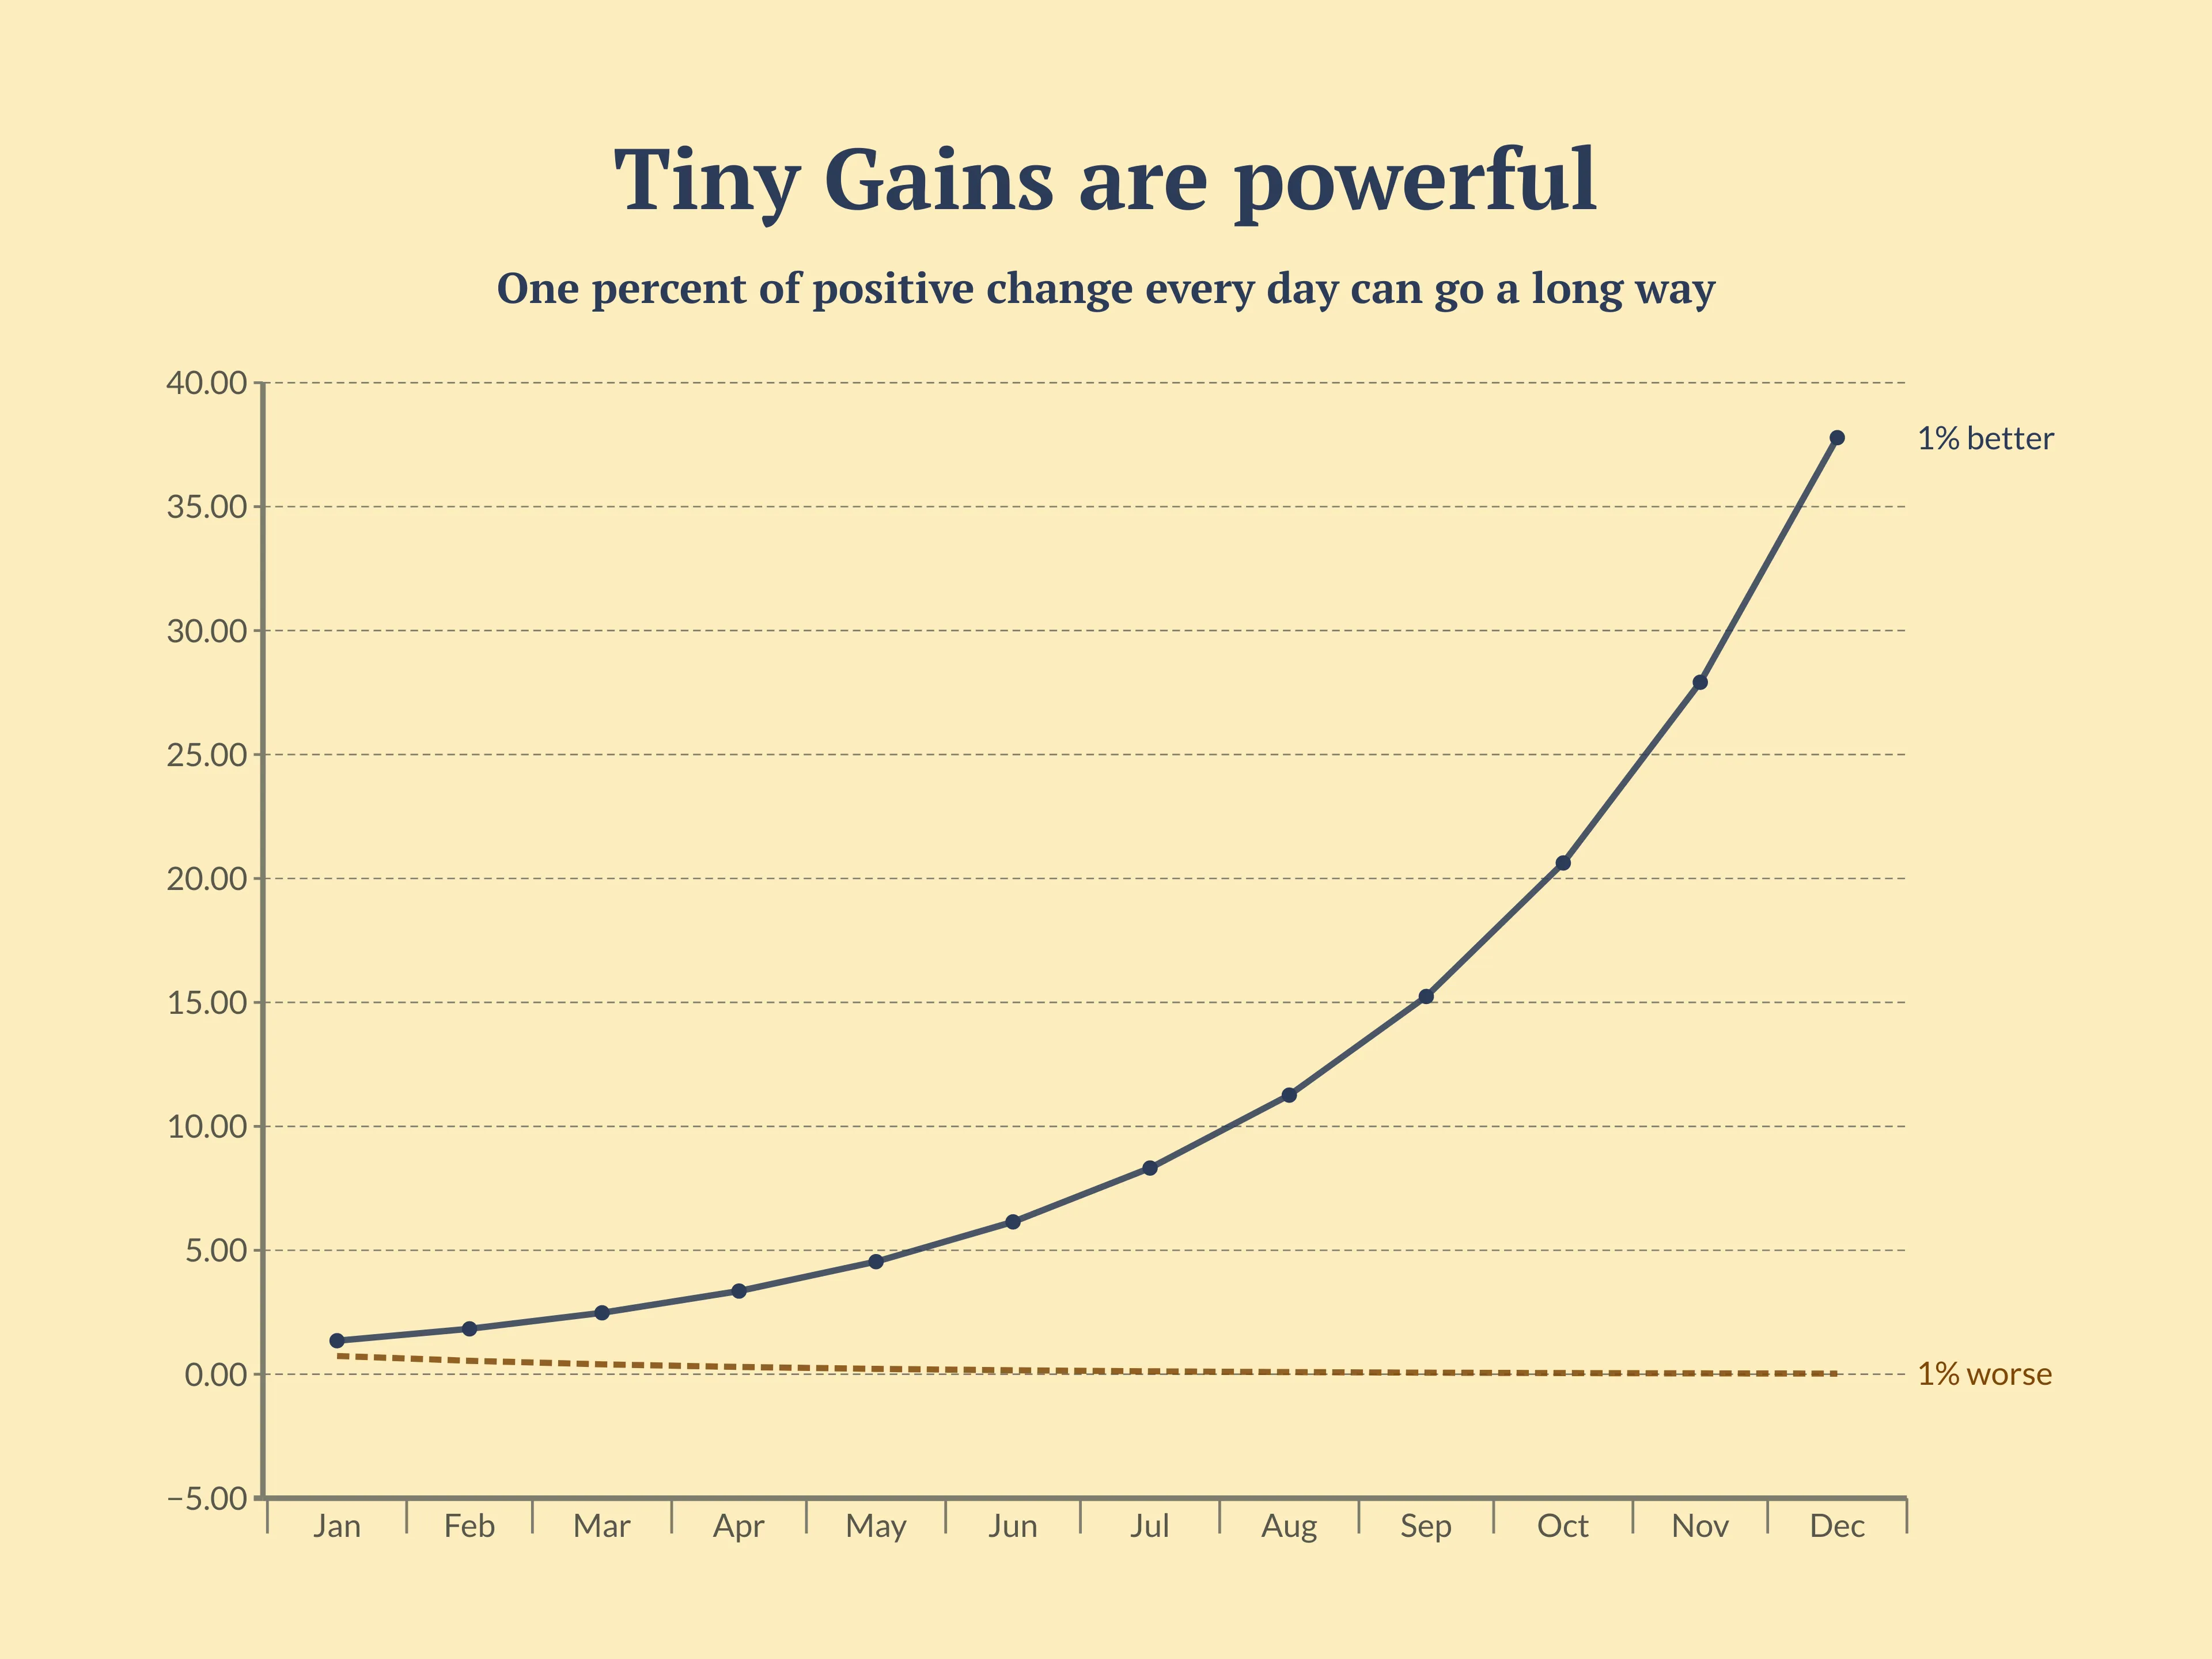
You are your only competition, your only obstacle to overcome, and guess what!? You are in control. Think about it this way; if you improve yourself as little as 1% more than the day before, at the end of a year, you will be an exponentially greater version of yourself with big gains. If on the contrary, you were to have a negative growth every day, always 1% lesser than the day before, at the end of the year you would be left with almost nothing to show for. So make the decision and make every day count. Take a look at this financial example from Forbes and what a difference it would make to apply the One Percent Rule to your savings.
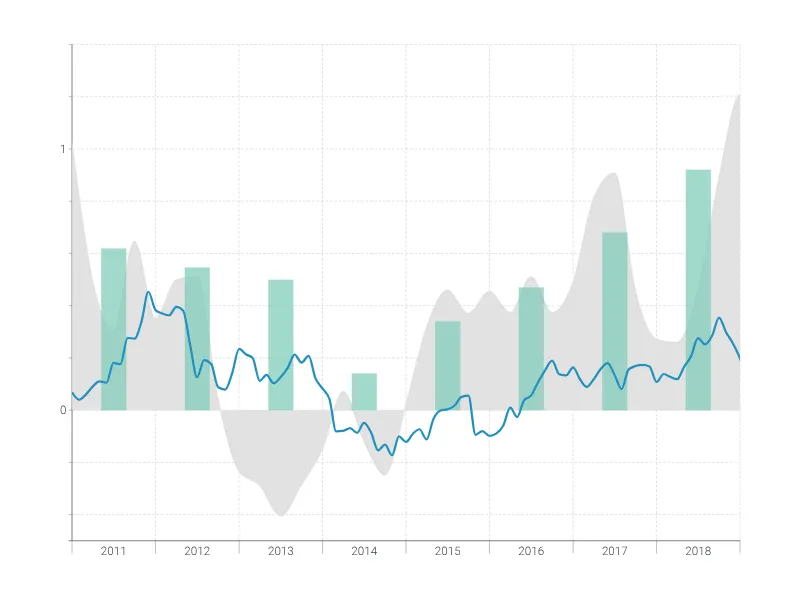
Dies ist ein Beispiel für Vizzlos "Zeitreihendiagramm"
Komplexes Zeitreihendiagramm zur Visualisierung detaillierter Finanzdaten.
Finanzen & Wirtschaft Balken- & Säulendiagramme Linien- & Flächendiagramme Zeitbasierte Diagramme