Chart Vizzard
Vizzlos KI-basierter Diagramm-GeneratorTrump on Twitter
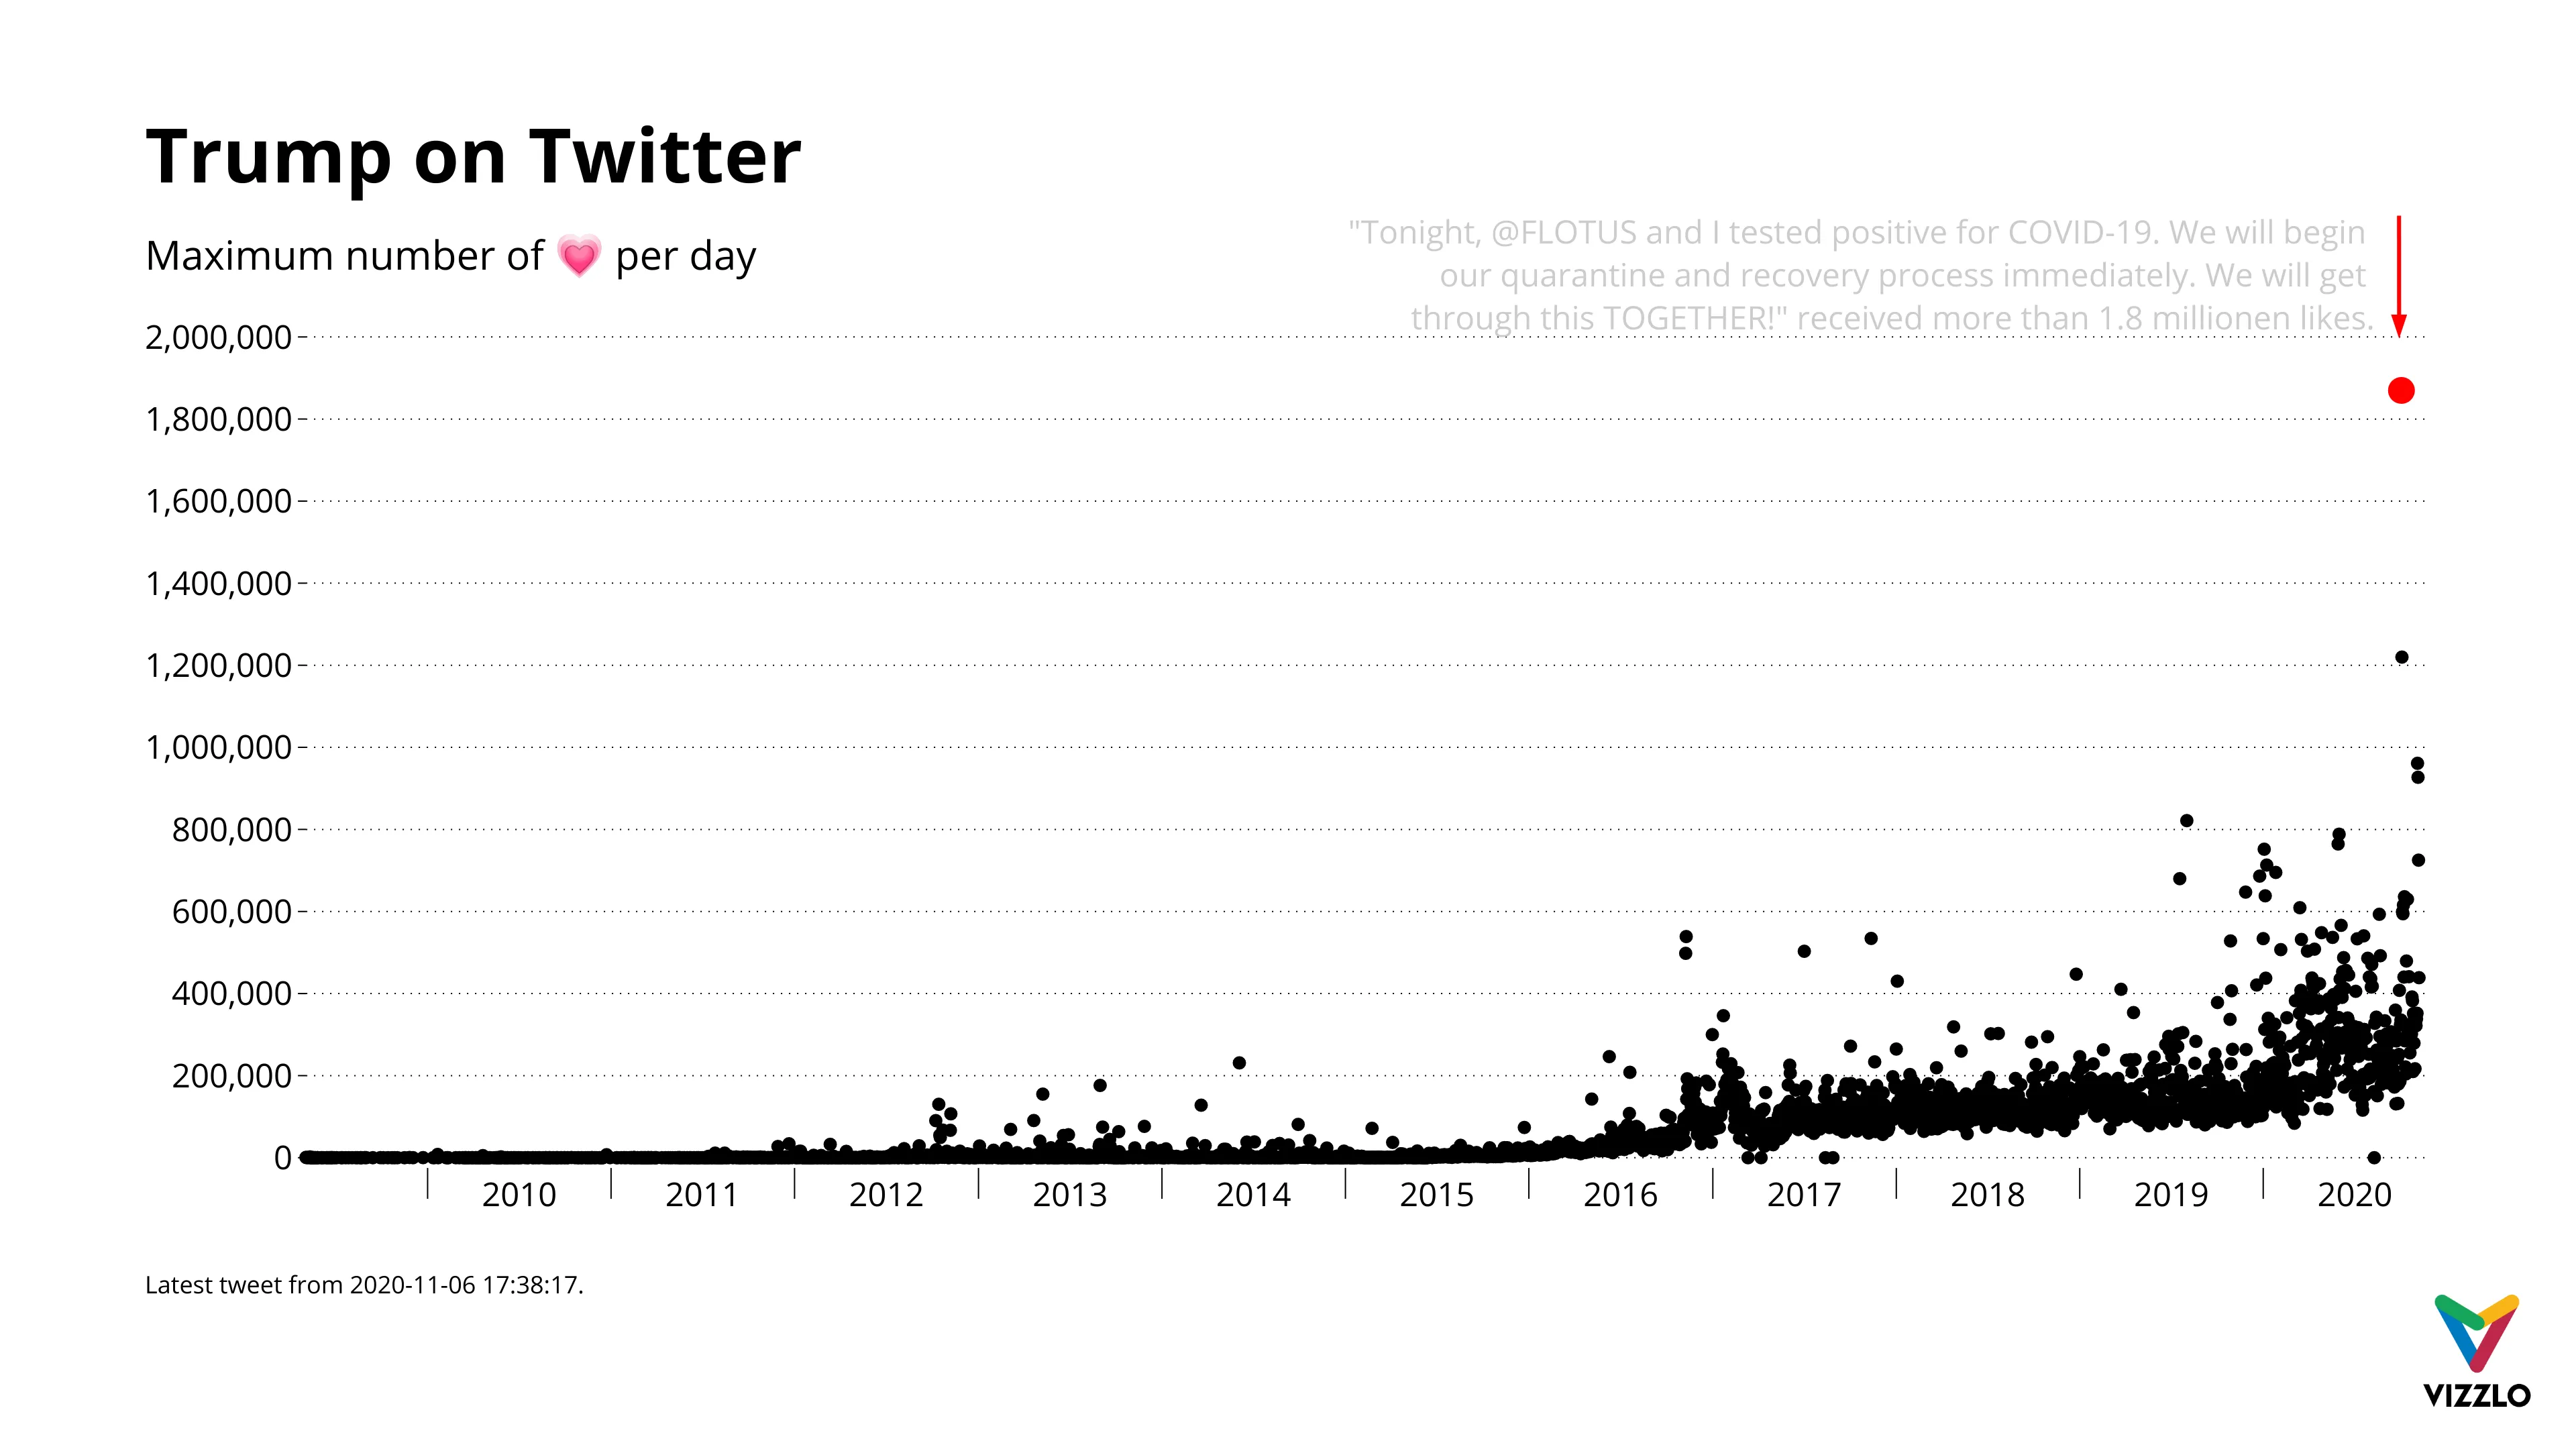
President Trump uses Twitter like no other US president before him. Since he took office in January 2017, the number of followers has grown steadily and with it the number of likes for his statements. Currently, the outgoing US president is mainly busy on Twitter criticizing the past elections, which brings him great popularity from his supporters. None of his tweets, however, received more likes than the one from October 2, when he announced that he was tested positive for COVID-19.
Source: Trump Twitter Archive
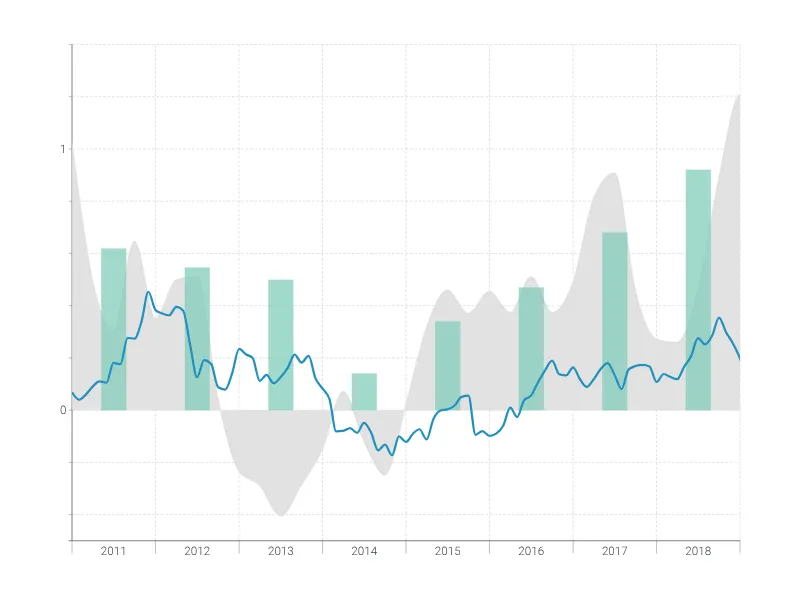
Dies ist ein Beispiel für Vizzlos "Zeitreihendiagramm"
Komplexes Zeitreihendiagramm zur Visualisierung detaillierter Finanzdaten.
Finanzen & Wirtschaft Balken- & Säulendiagramme Linien- & Flächendiagramme Zeitbasierte Diagramme