Chart Vizzard
Vizzlos KI-basierter Diagramm-Generator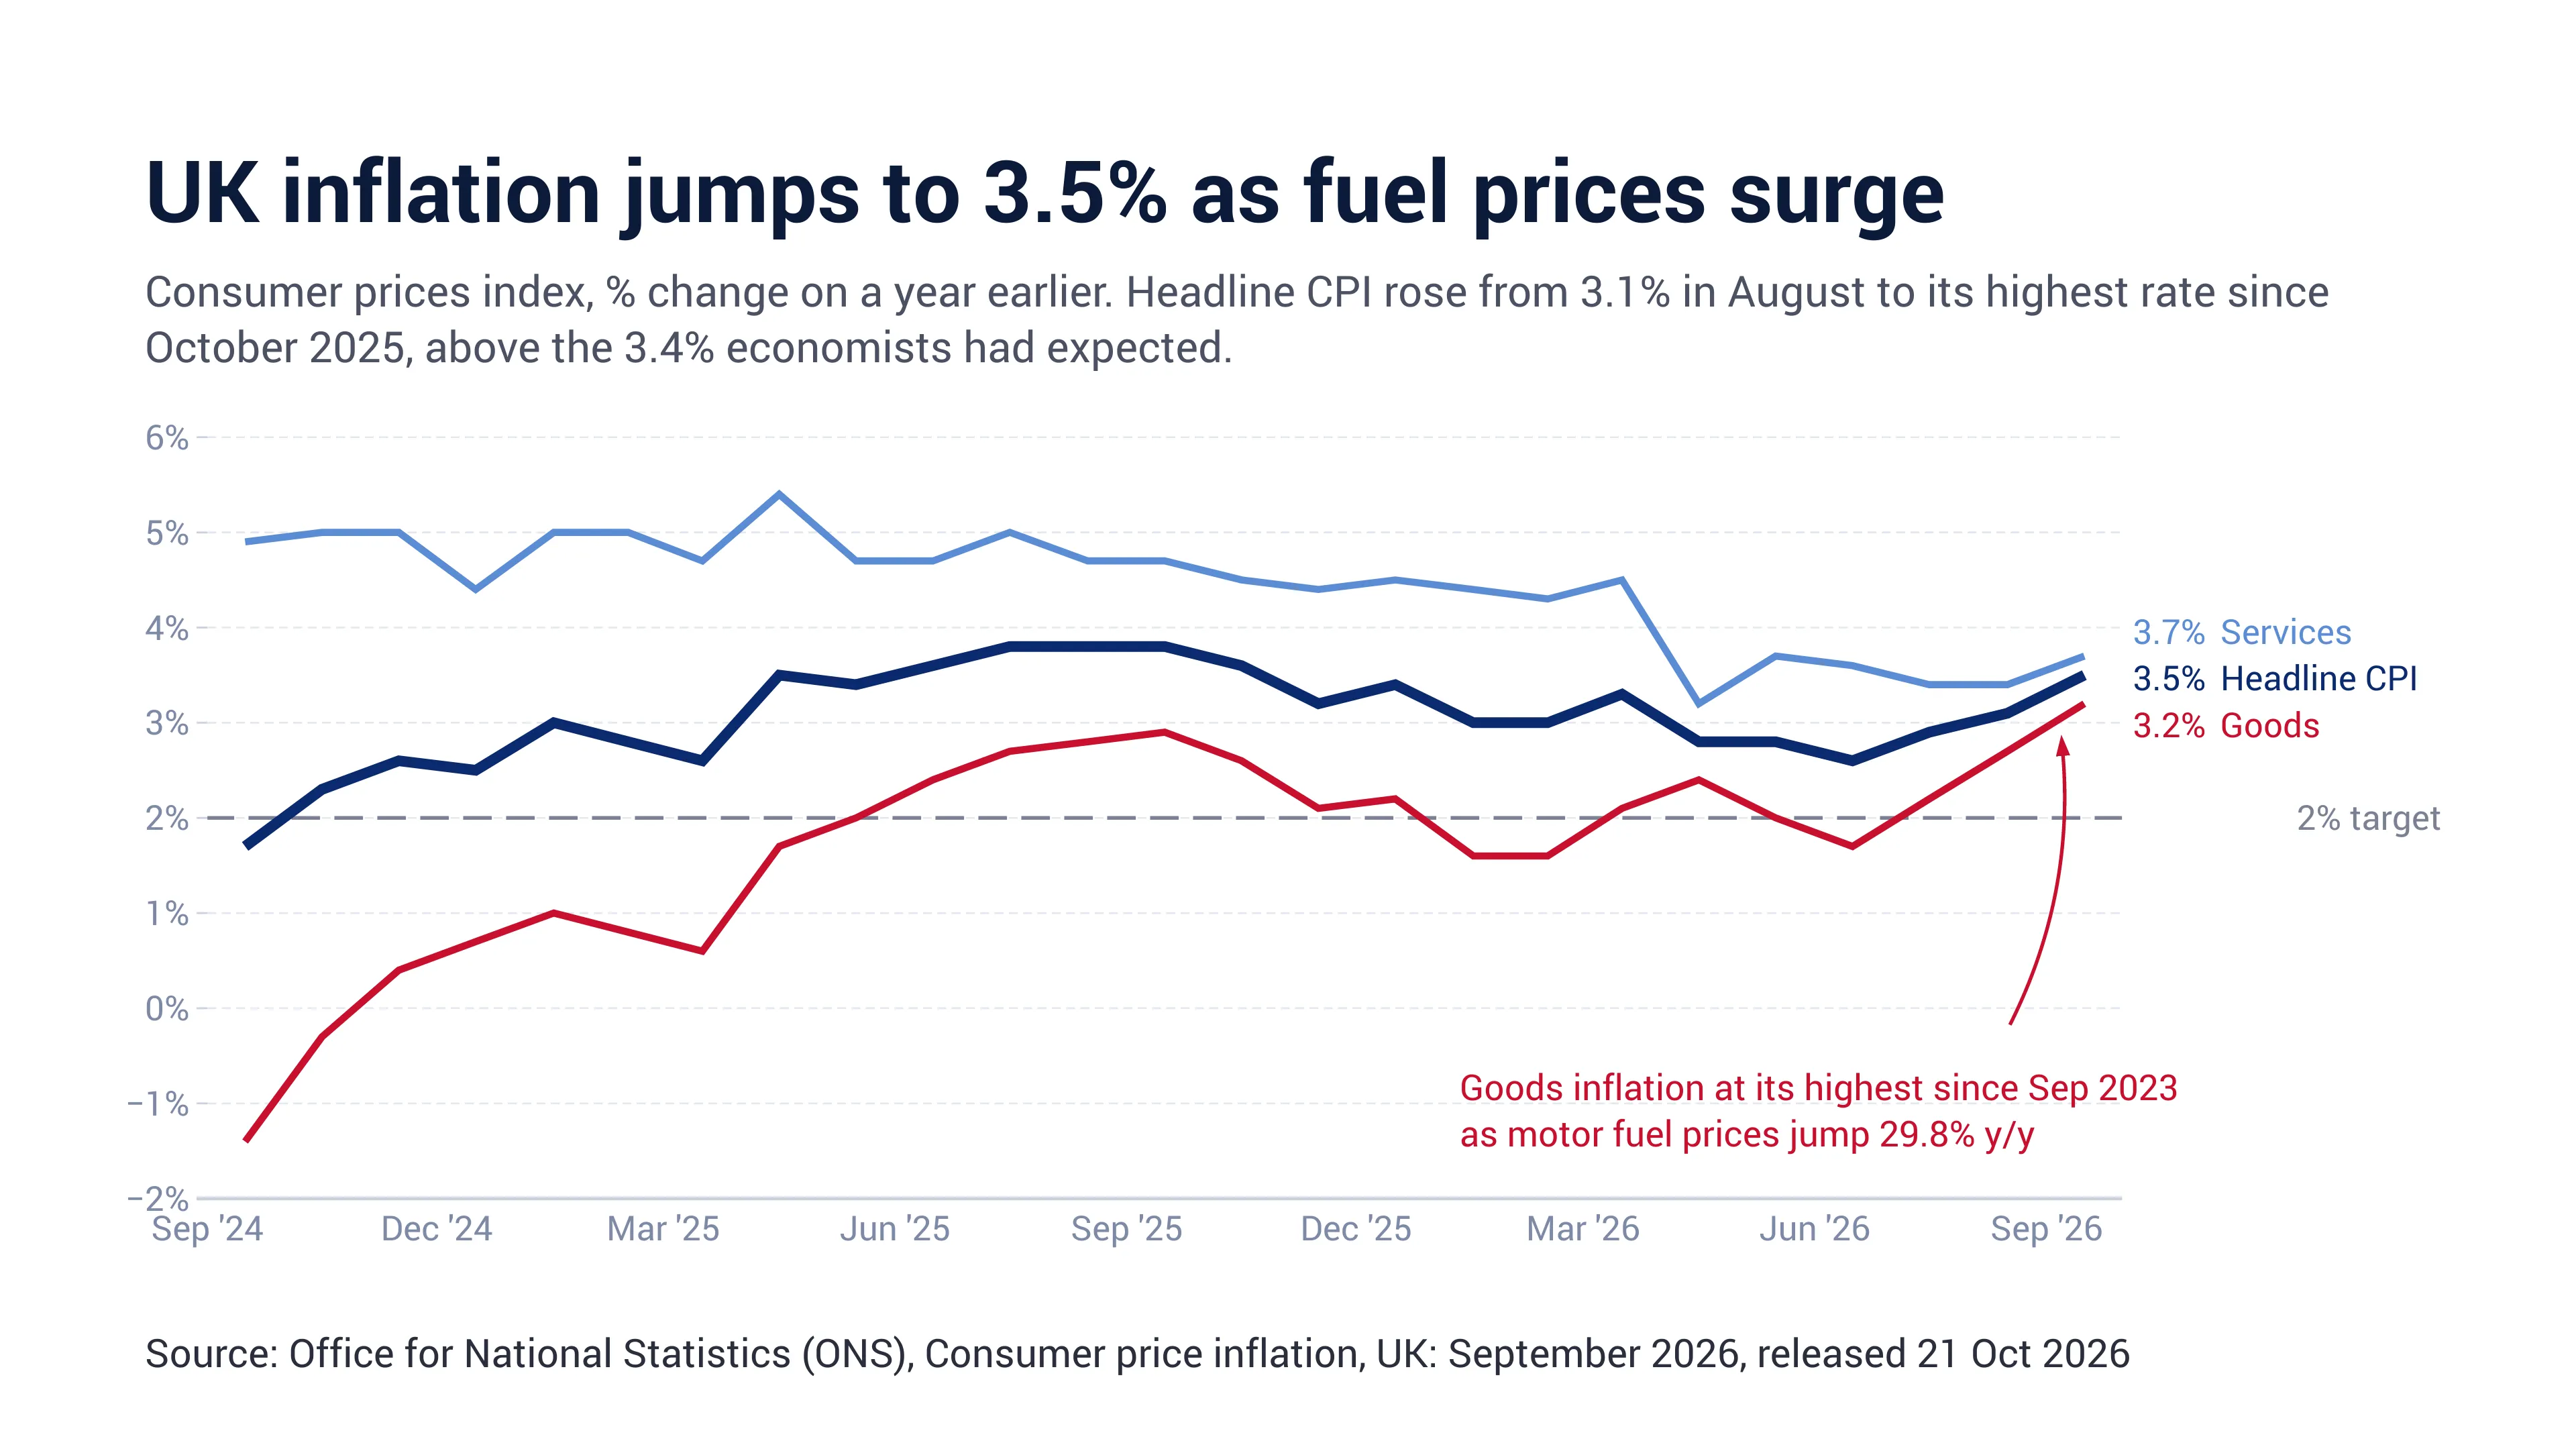
UK inflation jumps to 3.5% as fuel prices surge
UK consumer price inflation rose to 3.5% in the 12 months to September 2026, up from 3.1% in August, according to the Office for National Statistics (released 21 October 2026). It is the highest CPI rate since October 2025 and came in above the 3.4% that economists polled by Reuters had expected, and well above the 3.0% the Bank of England had pencilled in for September in its July forecasts (Reuters via Investing.com).
Fuel drives a broad pick-up
Transport, and motor fuels in particular, made the largest upward contribution to the change in the rate: transport inflation rose to 6.6% from 4.6% and contributed 0.94 percentage points to annual CPI. Motor fuel prices were up 29.8% on a year earlier (from 23.0% in August), the highest since August 2022, with petrol averaging 169.5p and diesel 192.5p per litre (ONS). Commentators link the fuel and energy surge to the Iran war constraining oil supply (MoneyWeek). As a result, goods inflation climbed to 3.2%, its highest since September 2023. Services inflation also rose, to 3.7% from 3.4%, slightly above the 3.6% economists had forecast (Reuters via Investing.com). Restaurants and hotels made the largest offsetting downward contribution.
| Measure (12-month rate) | Aug 2026 | Sep 2026 |
|---|---|---|
| CPI, all items | 3.1% | 3.5% |
| CPI goods | 2.7% | 3.2% |
| CPI services | 3.4% | 3.7% |
| Core CPI (excl. energy, food, alcohol, tobacco) | 2.6% | 2.8% |
| CPIH (incl. owner occupiers’ housing costs) | 3.3% | 3.6% |
| Transport | 4.6% | 6.6% |
| Motor fuels | 23.0% | 29.8% |
| Housing and household services | 4.9% | 5.3% |
| Food and non-alcoholic beverages | 1.3% | 1.3% |
| Restaurants and hotels | 4.1% | 3.8% |
Headline CPI over the period shown: 1.7% in September 2024, a peak of 3.8% from July to September 2025, 2.6% in June 2026 (the lowest reading of this year), and 3.5% now (ONS series D7G7).
What it means
The overshoot strengthens the case for a rate rise at the Bank of England’s next decision on 5 November: investors and many analysts expect the BoE to raise Bank Rate to 4% (Reuters via Investing.com). Forecasters see more to come: Capital Economics expects CPI to peak at about 4.2% next year, including a likely rise in utility prices in January, while ING expects a peak of around 4% this winter (Investing.com). Views differ on whether energy costs are already spreading to other prices: Capital Economics sees tentative signs, ING does not yet. The figures also land a week before the Chancellor’s Budget on 28 October. The next ONS inflation release, for October, is due on 18 November 2026.
How to read the chart
- Dark navy line (thick): headline CPI, annual rate, % (ONS series D7G7).
- Light blue line: CPI services, annual rate (D7NN).
- Red line: CPI goods, annual rate (D7NM).
- Labels at the right end of each line show the September 2026 value.
- Dashed grey line: the government’s 2% CPI inflation target, which the Bank of England is tasked with meeting.
- Red callout: highlights the jump in goods inflation to its highest since September 2023, driven by motor fuels.
- Monthly data, September 2024 to September 2026; x-axis ticks every three months.
Sources
- Consumer price inflation, UK: September 2026, Office for National Statistics, 21 October 2026
- CPI annual rate 00: all items (D7G7), ONS time series, updated 21 October 2026
- CPI annual rate: services (D7NN), ONS time series, updated 21 October 2026
- CPI annual rate: goods (D7NM), ONS time series, updated 21 October 2026
- UK inflation picks up more than expected to 3.5% in September, Reuters (Suban Abdulla) via Investing.com, 21 October 2026
- UK inflation hits 3.5% in September on fuel costs; BoE hike seen in November, Investing.com, 21 October 2026
- Live: Inflation rose to 3.5% in September, MoneyWeek, 21 October 2026
Notes
- All rates are 12-month changes in the Consumer Prices Index as published by the ONS on 21 October 2026, rounded to one decimal place.
- “Goods” and “services” are the ONS’s special aggregates; core CPI excludes energy, food, alcohol and tobacco. Core CPI and CPIH are shown in the table only, not in the chart.
- The 3.4% consensus and the 3.0% BoE projection are taken from Reuters reporting; the outlook figures (peaks of ~4.2% and ~4%) are private-sector forecasts, not official projections.
- The link between the fuel surge and the Iran war is commentators’ attribution, not an ONS statement.
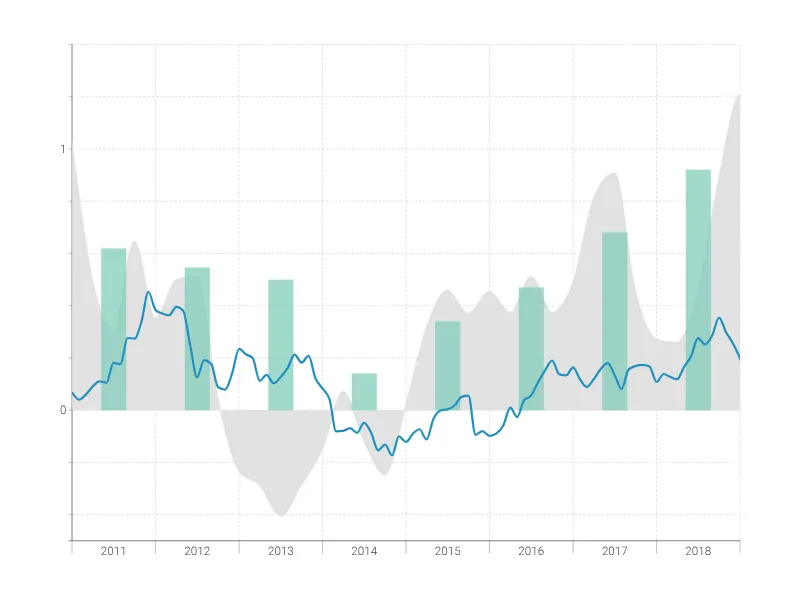
Dies ist ein Beispiel für Vizzlos "Zeitreihendiagramm"
Komplexes Zeitreihendiagramm zur Visualisierung detaillierter Finanzdaten.
Finanzen & Wirtschaft Balken- & Säulendiagramme Linien- & Flächendiagramme Zeitbasierte Diagramme